
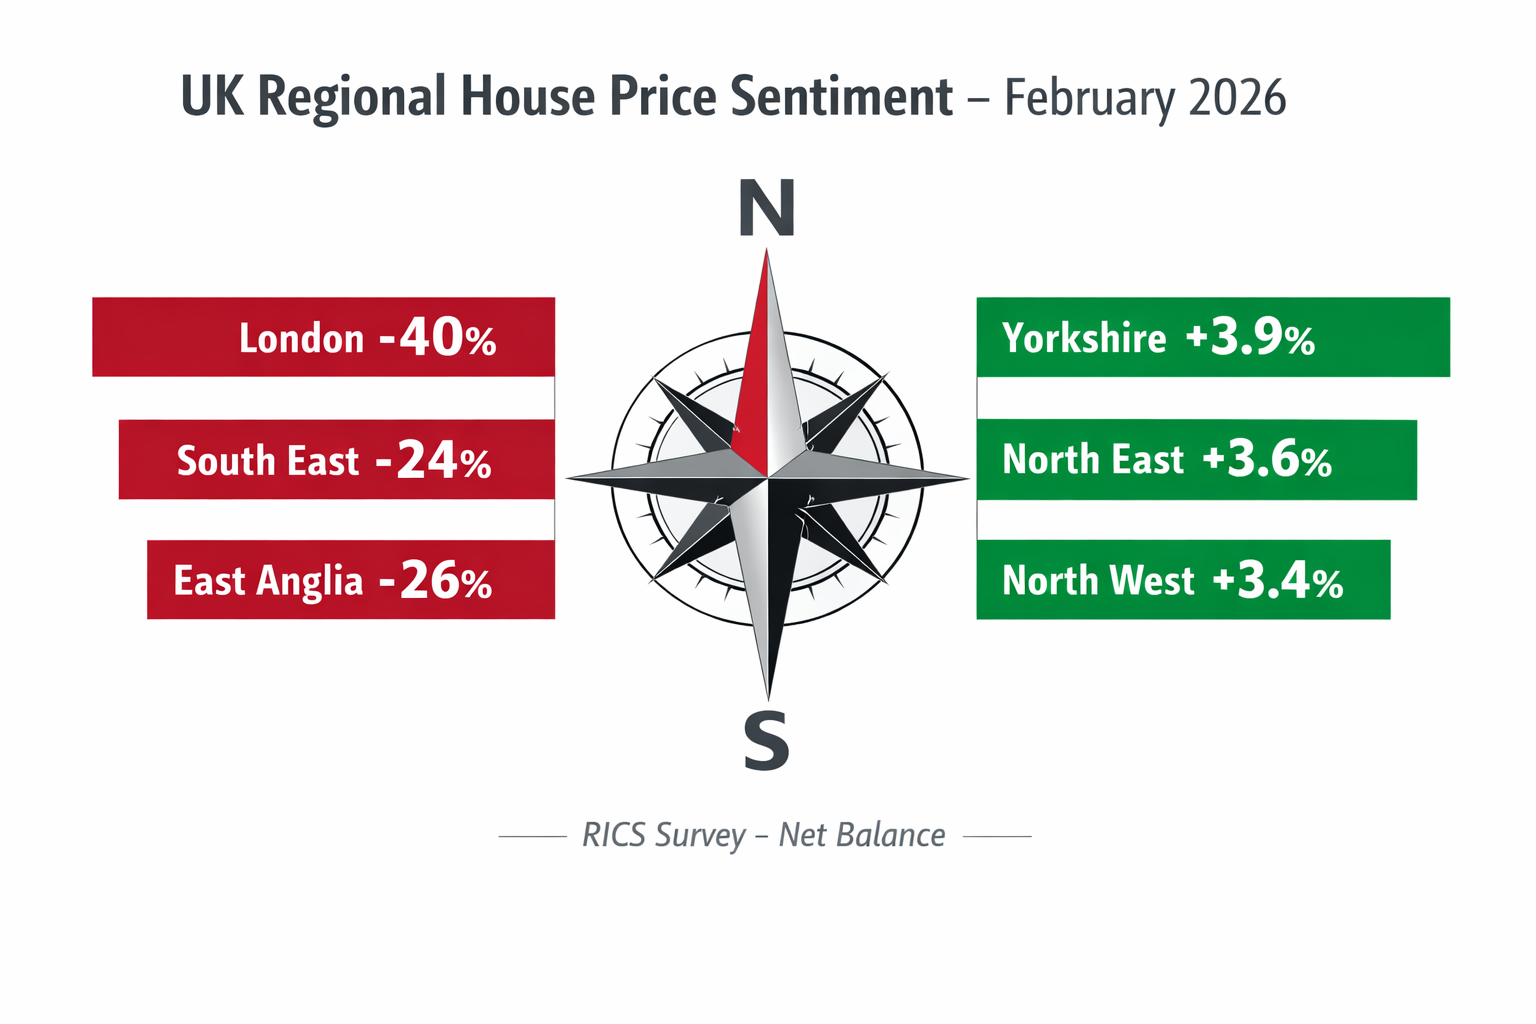
London's house price sentiment hit -40% net balance in February 2026 — the steepest regional decline recorded in the RICS monthly survey — while Yorkshire and the Humber posted annual price growth of +3.9% in the same period. That 44-point gap between the capital and the North is not a rounding error. It is a structural signal that demands precise, evidence-led valuation adjustments in regional divergences from every practising surveyor. The RICS February 2026 data for surveyors in London vs North makes one thing unmistakably clear: a single national headline figure no longer serves as a reliable anchor for property valuations. [1][2]
Key Takeaways 📌
- London is the hardest-hit region, with a -40% price sentiment net balance and a -3.3% annual price decline in February 2026. [1][2]
- Northern regions are outperforming, with Yorkshire (+3.9%), North East (+3.6%), and North West (+3.4%) all recording positive annual price growth. [2]
- National headline data masks extreme divergence — the UK-wide net balance of -12% is almost meaningless at a regional level. [1]
- Surveyor sentiment for London's 12-month outlook collapsed from +56% in January to just +7% in February 2026 — a 49-point swing. [1][3]
- Accurate valuation adjustments now require region-specific comparable evidence, not national averages.
Understanding the February 2026 RICS Data: A Tale of Two Markets
The RICS UK Residential Market Survey for February 2026 paints a picture of profound geographic fracture. [1] The national headline price net balance of -12% sounds modest — but it is an arithmetic average of wildly opposing regional realities. [3]
London: Cooling at Speed
London recorded a -40% net balance for price sentiment in February 2026, the worst reading of any English region. [1] This was not a gradual drift. The monthly house price change for London stood at -1.9% — the steepest single-month fall across all regions. [2] On an annual basis, London properties declined by -3.3% in the 12 months to February 2026, making it the only English region with negative annual inflation against a UK average rise of +1.2%. [2]
💬 "The national headline figure of -12% is almost meaningless for a London surveyor trying to justify a Red Book valuation in 2026. The regional data tells the real story."
The collapse in forward-looking sentiment is equally striking. The 12-month price expectations net balance for London plummeted from +56% in January to just +7% in February 2026 — a 49-point swing within a single reporting month. [1][3] Near-term (3-month) price expectations across the UK also fell sharply, dropping to -18% in February from -6% in January, with London-focused surveyors driving much of that deterioration. [1][3]
The South East and East Anglia are not far behind London in negative territory. The South East reported a -24% price net balance and East Anglia -26%, placing both regions in a second tier of downward pressure. [1][3] Surveyors operating across these southern markets face a consistent challenge: comparable evidence from even six months ago may now be materially misleading.
The North: Resilience With Regional Nuance
The contrast could hardly be sharper. Yorkshire and the Humber led all English regions with +3.9% annual house price inflation in the 12 months to February 2026. [2] The North East posted +3.6% annual growth and an impressive +2.7% monthly change — one of the strongest short-term readings in the country. [2] The North West recorded +3.4% annual growth and a +1.1% monthly rise. [2]
Beyond England, Northern Ireland achieved +7.5% annual growth (Q4 2025 data), with an average price of £196,000 — the strongest performance of any UK nation. [2] Scotland maintained steady upward momentum at +2.3% annually, with an average price of £187,000. [1][2]
| Region | Annual Price Change | Monthly Change | RICS Sentiment |
|---|---|---|---|
| London | -3.3% | -1.9% | -40% net balance |
| South East | Below UK avg | Negative | -24% net balance |
| East Anglia | Below UK avg | Negative | -26% net balance |
| North West | +3.4% | +1.1% | Positive |
| North East | +3.6% | +2.7% | Positive |
| Yorkshire & Humber | +3.9% | Positive | Positive |
| Northern Ireland | +7.5% | — | Positive |
| Scotland | +2.3% | Positive | Positive |
| UK Average | +1.2% | Modest | -12% net balance |
Sources: [1][2][3]
Valuation Adjustments in Regional Divergences: Practical Strategies for Surveyors

The February 2026 data demands a recalibration of valuation methodology. Surveyors who apply a single national trend to their comparable evidence risk producing figures that are either inflated (in London) or understated (in the North). Here is how to approach valuation adjustments in regional divergences with the rigour the RICS February 2026 data for surveyors in London vs North demands.
1. 🔍 Tighten the Comparable Search Radius
In a fast-moving market — whether falling in London or rising in Yorkshire — comparables from outside the immediate locality carry increasing distortion risk. The guidance is clear:
- London surveyors should prioritise comparables from the last 3 months maximum, given the -1.9% monthly decline. [2] A comparable from Q3 2025 in a falling London market could overstate value by 4–6%.
- Northern surveyors should be alert to the opposite risk: under-valuing property by relying on older comparables that predate the current growth cycle.
For RICS-registered valuers working across both geographies, maintaining separate comparable databases by region — rather than pooling national evidence — is now essential practice.
2. 📊 Apply Time Adjustments to Comparables
The RICS Red Book (RICS Valuation – Global Standards) permits time adjustments to comparable evidence where market movement can be evidenced. The February 2026 data provides that evidence in abundance.
For London properties, a downward time adjustment of approximately 1.5–2% per month is defensible based on the -1.9% monthly decline recorded. [2] This must be documented transparently within the Red Book valuation report, with the RICS survey data cited as supporting evidence.
For Northern markets, a modest upward time adjustment may be appropriate, particularly in Yorkshire and the North East where monthly growth is measurable and sustained. [2]
3. 🏘️ Segment by Property Type and Micro-Location
Regional averages remain blunt instruments. Within London, prime central postcodes may be performing differently from outer zones. Within the North West, Manchester city centre dynamics differ from suburban Lancashire. Surveyors should:
- Cross-reference Land Registry price paid data at postcode level
- Use RICS survey data as a directional indicator, not a precise adjustment factor
- Assess valuation factors specific to each instruction — tenure, condition, accessibility, and local supply
4. 📋 Document the Regional Context Explicitly
Every valuation report produced in 2026 should include a market commentary section that explicitly references the regional divergence. For London instructions, this means acknowledging the -40% sentiment reading and -3.3% annual decline. [1][2] For Northern instructions, the positive momentum data should be cited to support any upward adjustments.
This is not merely good practice — it is risk management. In a market where conditions are moving quickly in opposing directions, a surveyor who fails to document regional context faces greater exposure if a valuation is subsequently challenged.
For complex instructions — such as a non-domicile tax valuation or a capital gains tax valuation in London — the downward price trajectory must be explicitly addressed, as HMRC may scrutinise valuations that appear inconsistent with published market data.
5. 🔄 Revisit Existing Valuations
The 49-point swing in London's 12-month expectations — from +56% in January to +7% in February 2026 — is a clear signal that valuations prepared in late 2025 or early January 2026 may now be stale. [1][3] Surveyors should proactively flag to clients where:
- A valuation is more than 3 months old in a London or South East context
- The instruction involves a transaction with a long completion timeline
- The property is in a segment (e.g., higher-value stock) that has shown greater sensitivity to sentiment shifts
Applying RICS February 2026 Data for Surveyors in London vs North: Sector-Specific Considerations

The regional divergence captured in the RICS February 2026 data for surveyors in London vs North plays out differently depending on the type of instruction. Below are the key sector-specific implications.
Residential Purchase Surveys
For buyers commissioning a RICS home survey in London, the current market context amplifies the importance of an accurate survey. In a falling market, a surveyor's identification of defects carries greater negotiating weight — a £15,000 repair cost in a market declining at nearly 2% per month is a meaningful lever. Buyers in Northern markets, conversely, face competitive conditions where survey findings need to be acted upon quickly to avoid losing a property.
Commercial Valuations
Commercial property surveyors face compounded complexity. Occupier demand, rental yield compression, and capital value trends do not always mirror residential patterns — but the macro-economic sentiment captured in RICS data provides relevant context. Commercial property surveyors working in London must be especially careful not to extrapolate pre-2026 rental growth assumptions into current valuations.
For rent review instructions in London, the weakening occupier demand signalled by negative RICS sentiment should inform the comparable evidence selection and any open market rental value assessments.
Probate and Matrimonial Valuations
Legal-context valuations carry particular risk in a fast-moving market. A probate valuation or divorce valuation in London conducted using January 2026 comparables could now overstate value by a meaningful margin, given the -1.9% monthly decline. [2] Solicitors and executors should be advised to commission fresh valuations where the date of death or separation falls before the February 2026 data was published.
Building Surveys and Defect Reports
Market conditions influence how surveying findings are weighted in negotiations. In London's cooling market, a Level 3 building survey identifying significant defects provides buyers with stronger grounds for price renegotiation. In Northern markets where demand is robust, buyers may have less negotiating leverage even where defects are identified — making the survey's role as a risk-assessment tool (rather than a negotiating instrument) more prominent.
Why National Data Misleads: The Case for Regional Valuation Discipline
The UK-wide net balance of -12% in February 2026 is the kind of figure that appears in newspaper headlines and is subsequently misapplied to individual property decisions. [1][3] It represents neither London's reality nor Yorkshire's. It is the arithmetic mean of two opposing markets.
This is not a new problem, but the scale of divergence in February 2026 is exceptional. A 44-percentage-point gap between London (-40%) and the leading Northern regions (positive territory) is one of the widest regional splits in recent RICS survey history. [1][3]
For surveyors, the professional and legal implications are clear. RICS standards require that valuations reflect the market as it exists at the date of valuation. In a market defined by valuation adjustments in regional divergences, relying on national data is not a neutral choice — it is an active source of error.
The methods of valuation available to RICS practitioners — comparative, income, residual, profits, and cost approaches — all require market evidence as their foundation. When that evidence is regionally divergent, the methodology must adapt accordingly.
Conclusion: Actionable Steps for Surveyors in 2026 ✅
The RICS February 2026 data delivers an unambiguous message: regional divergences are now the defining characteristic of the UK property market, and valuation adjustments must reflect this reality with precision.
Immediate actions for surveyors:
- Audit your comparable evidence — ensure all active instructions use comparables from within the last 90 days, particularly for London and South East properties.
- Apply documented time adjustments — use the -1.9% monthly London decline [2] and positive Northern growth figures as the evidential basis for time-based comparable adjustments.
- Update market commentary templates — every valuation report in 2026 should explicitly reference the regional context drawn from RICS and HM Land Registry data. [1][2]
- Flag stale valuations proactively — any London or South East valuation prepared before February 2026 should be reviewed against current market conditions before reliance.
- Engage clients on regional nuance — buyers, sellers, and legal professionals often rely on national headlines. Surveyors have a professional duty to correct that misunderstanding with region-specific data.
- Seek specialist support where needed — for complex instructions in rapidly moving markets, working with chartered surveyors in London or chartered surveyors in North London who have live, local market knowledge is the most reliable safeguard against valuation error.
The February 2026 data is not a warning of things to come — it is a description of conditions that already exist. Surveyors who adjust their practice accordingly will produce more defensible, more accurate, and ultimately more valuable work for their clients.
References
[1] UK Residential Survey February 2026 – https://www.rics.org/news-insights/uk-residential-survey-february-2026
[2] UK House Price Index Summary February 2026 – https://www.gov.uk/government/statistics/uk-house-price-index-for-february-2026/uk-house-price-index-summary-february-2026
[3] UK Residential Market Survey February 2026 – https://www.rics.org/content/dam/ricsglobal/documents/market-surveys/uk-residential-market-survey/UK-Residential-Market-Survey_February-2026.pdf