
{"cover":"Professional landscape format (1536×1024) editorial hero image featuring bold text overlay 'Valuation Adjustments for RICS February 2026 Market Survey Insights' in extra large 70pt white sans-serif font with subtle dark gradient shadow, positioned in upper third with perfect center alignment. Background shows sophisticated split-screen composition: left side displays detailed UK regional map with color-coded heat zones showing property valuation variations from deep red (declining) to cool blue (rising), right side features modern chartered surveyor reviewing digital tablet with property data and market graphs in contemporary office setting with large windows overlooking London skyline. Foreground includes transparent overlay boxes showing key statistics: -26% buyer demand, -40% London prices, +33% 12-month outlook. Color palette: navy blue, white, amber accents with professional gradients. Magazine cover aesthetic, high contrast, editorial quality with depth of field effect.","content":["Landscape format (1536×1024) detailed infographic illustration showing UK map divided into distinct regions with contrasting color zones representing February 2026 price movements: London and South East in deep red tones showing -40% and -24% net balance figures, Northern Ireland and Scotland in green tones indicating positive growth, East Anglia in orange showing -26% decline. Each region features floating data cards with specific net balance percentages, small property icons, and directional arrows. Center overlay displays large comparison chart contrasting January vs February buyer enquiry trends with downward trending line graph from -15% to -26%. Professional cartographic style with clean typography, subtle shadow effects, and RICS branding elements. Modern data visualization aesthetic with white background and strategic use of color to highlight regional divergence patterns clearly.","Landscape format (1536×1024) professional scene showing experienced RICS chartered surveyor conducting detailed property inspection inside residential property with visible structural elements. Surveyor holds digital tablet displaying valuation software interface with real-time market data feeds, comparable property analysis, and adjustment calculation tools. Background shows property features requiring assessment: period architectural details, modern extensions, visible building elements. Foreground includes transparent overlay showing valuation adjustment checklist with items like location premium factors, condition assessment criteria, market sentiment indicators, and regional price trend modifiers. Side panel displays before/after valuation figures with percentage adjustments clearly marked. Warm natural lighting through windows, professional business attire, serious concentrated expression. Photorealistic style with shallow depth of field focusing on surveyor and tablet screen, architectural photography aesthetic.","Landscape format (1536×1024) sophisticated composite image showing rental market dynamics visualization. Left third features stacked bar chart comparing landlord instructions (-27% net balance) versus tenant demand (+2% net balance) with contrasting red and green bars, clear percentage labels, and trend arrows. Center section displays modern rental property exterior with 'To Let' board, professional photography style with urban residential street context. Right third shows projected rental growth chart with upward trending line indicating +20% three-month expectations, annotated with monthly data points. Bottom overlay strip contains key rental valuation metrics in clean data boxes: supply shortage indicators, yield calculations, comparable rental evidence, and market rent adjustments. Professional financial publication aesthetic with clean white space, strategic color coding using teal, coral, and navy blue palette, clear typography hierarchy, and editorial quality composition suitable for property investment analysis reports."]"}
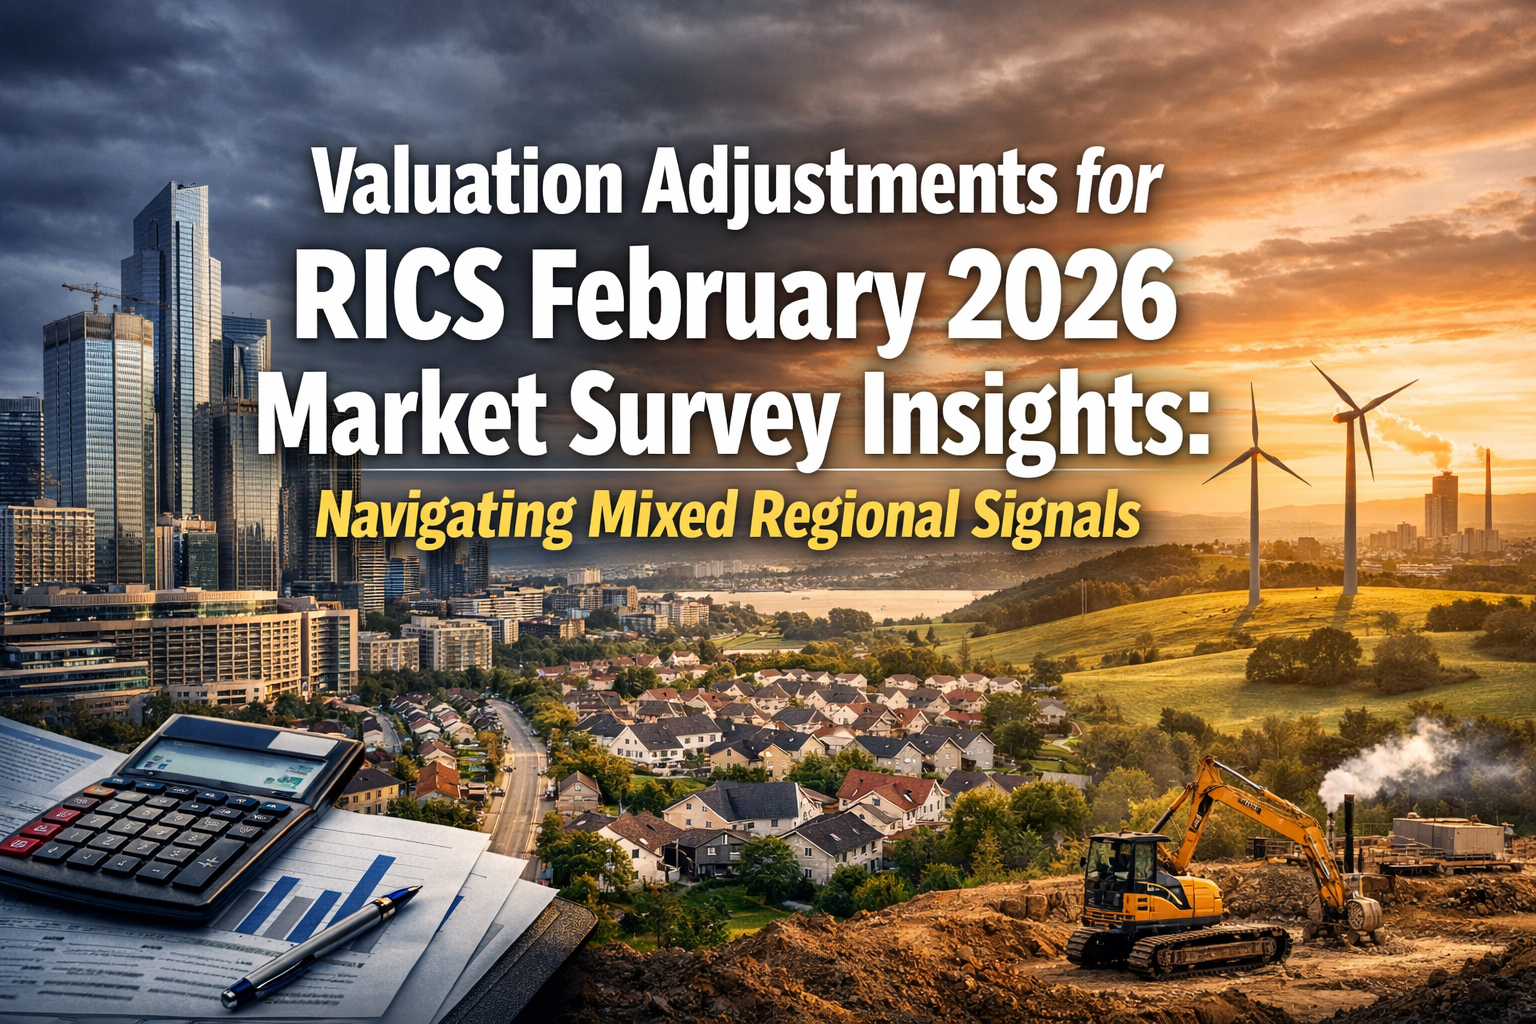
The February 2026 RICS Residential Market Survey reveals a stark contradiction: buyer demand plummeted to a net balance of -26%, yet surveyor confidence for 12-month price growth remains positive at +33%. This disconnect between immediate market weakness and medium-term optimism creates a complex valuation landscape where registered RICS valuers must navigate unprecedented regional divergence and recalibrate their assessment methodologies.
Understanding Valuation Adjustments for RICS February 2026 Market Survey Insights: Navigating Mixed Regional Signals has become essential for property professionals seeking to deliver accurate, defensible valuations in an environment where national headline figures mask dramatic local variations.
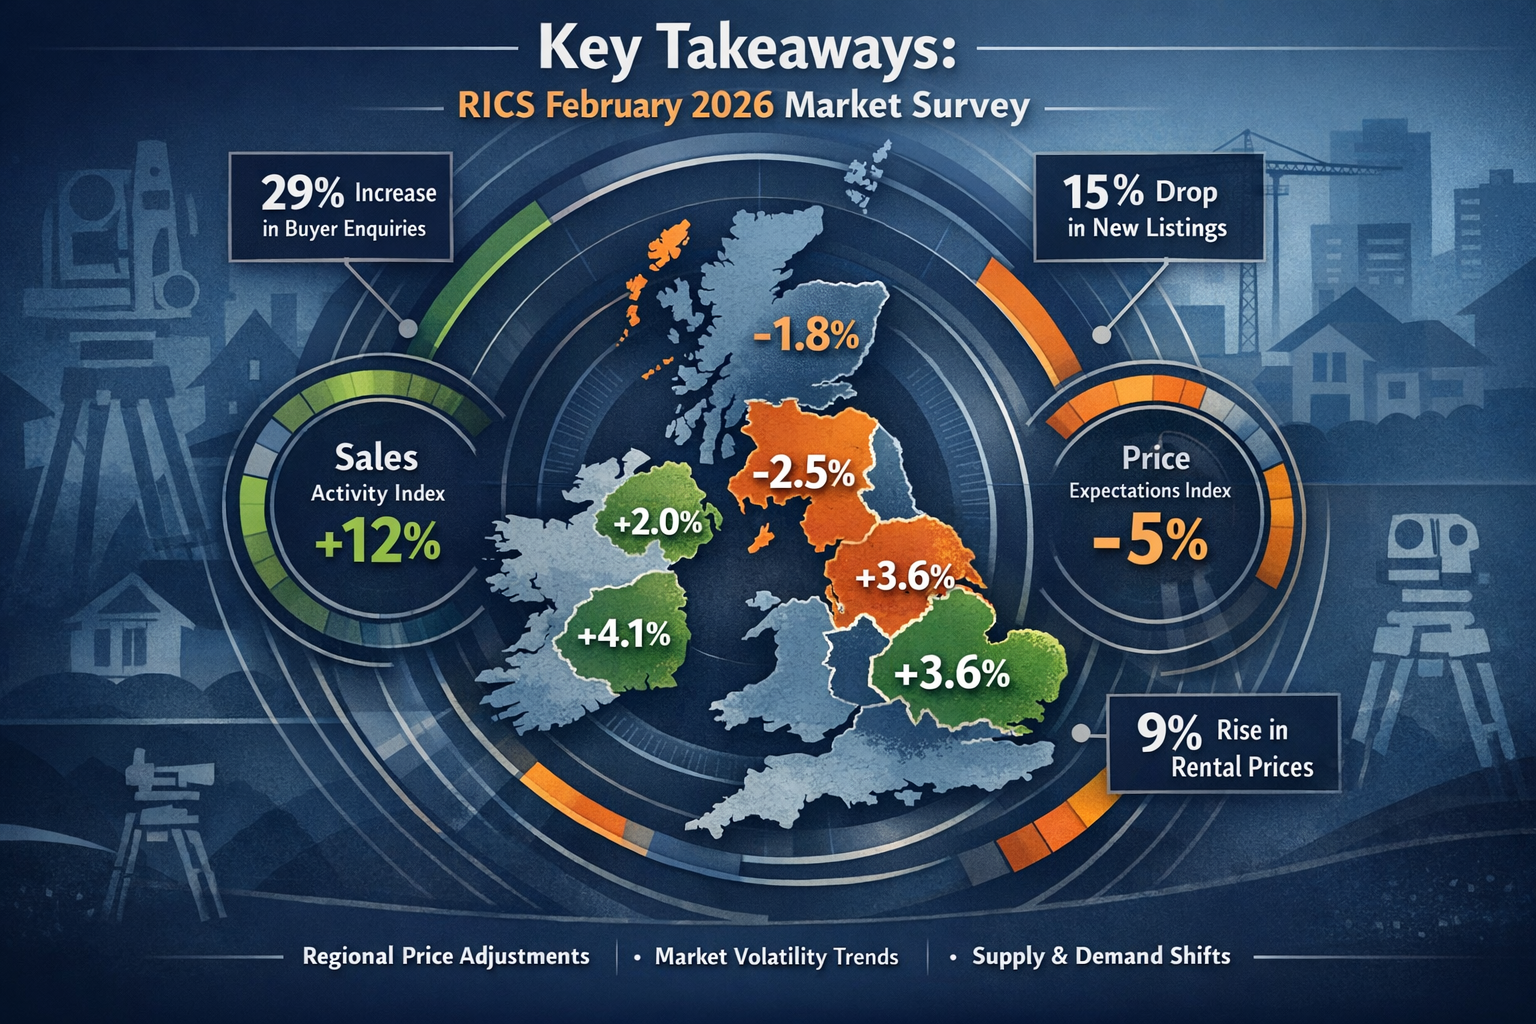
Key Takeaways
- 📉 Buyer demand declined sharply to -26% net balance in February 2026, down from -15% in January, signaling reduced transaction activity affecting valuation evidence
- 🗺️ Regional divergence reached extreme levels, with London experiencing -40% price pressure while Northern Ireland and Scotland maintained positive momentum
- 💼 Valuation professionals must implement sophisticated adjustment methodologies to account for mixed signals between subdued current activity and moderately optimistic 12-month outlooks
- 🏘️ Rental market valuations face unique challenges with landlord instructions at -27% creating supply constraints that support higher rental valuations despite broader market weakness
- 📊 Near-term price expectations turned negative at -18%, requiring valuers to carefully weight short-term versus medium-term market indicators
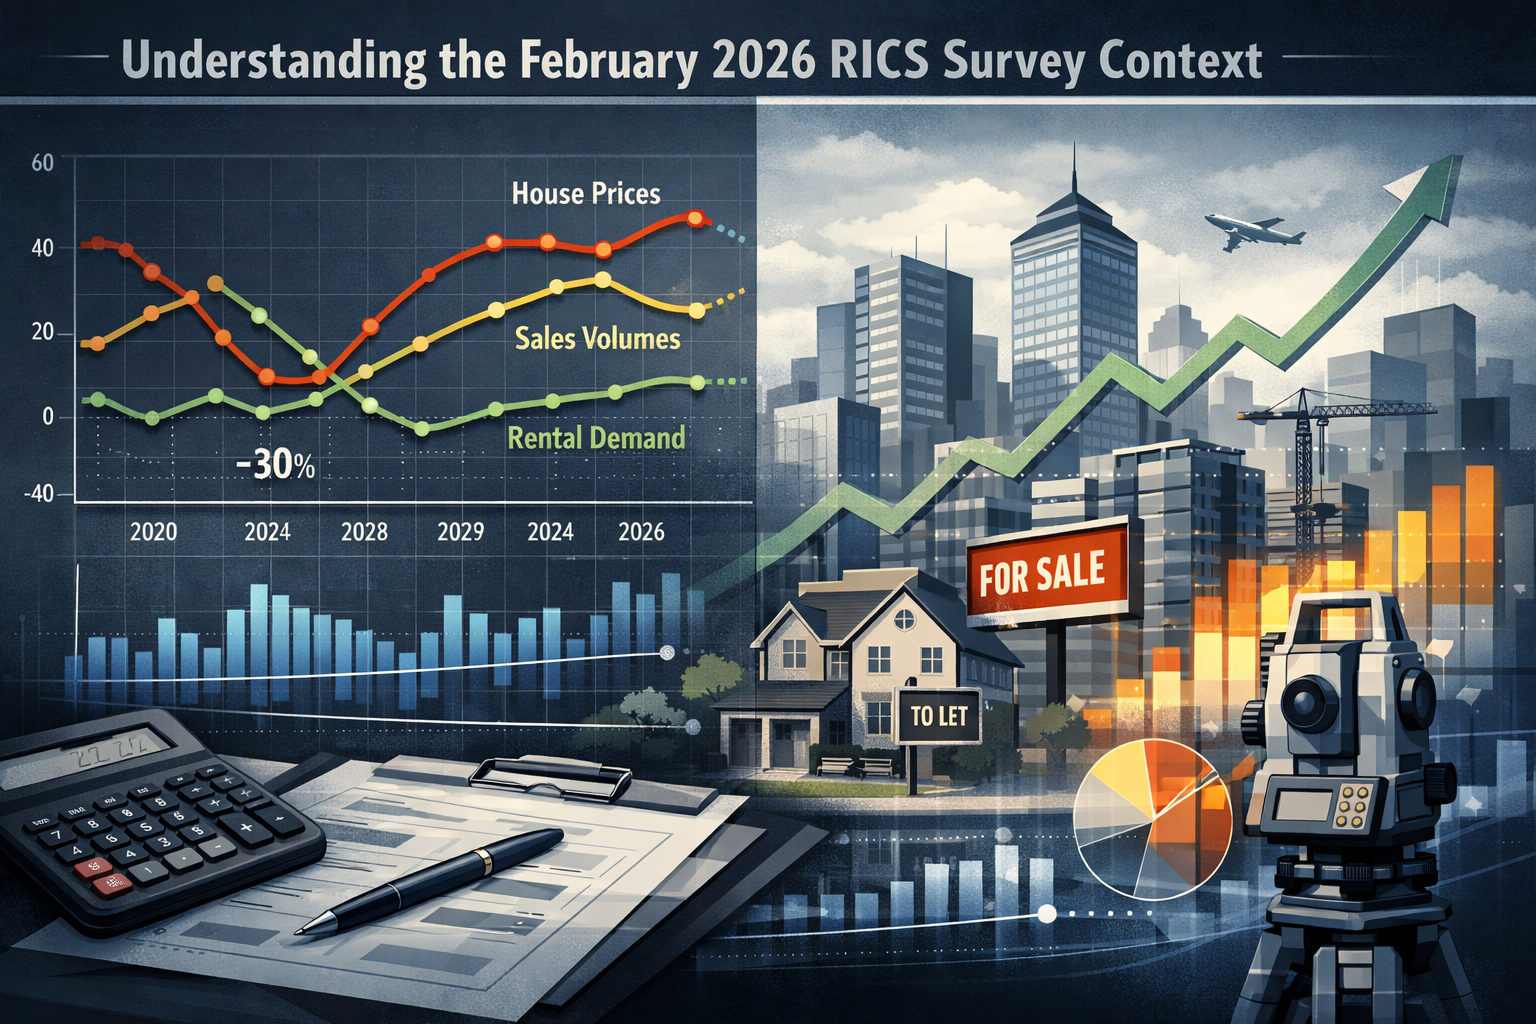
Understanding the February 2026 RICS Survey Context
The Royal Institution of Chartered Surveyors (RICS) conducts monthly residential market surveys that serve as critical barometers for property valuation professionals. The February 2026 data presents particularly challenging conditions for those conducting Red Book valuations and other formal assessments.
National Headline Figures Mask Regional Complexity
At the aggregate level, headline house prices remained essentially flat with a net balance of -12% in February, marginally weaker than January's -10%.[1] However, this national figure conceals dramatic regional variations that fundamentally alter valuation approaches depending on property location.
Key national indicators from February 2026:
| Metric | Net Balance | Change from January |
|---|---|---|
| New Buyer Enquiries | -26% | ↓ from -15% |
| Agreed Sales | -12% | Relatively stable |
| New Instructions | +2% | Minimal change |
| Headline Prices | -12% | ↓ from -10% |
| Near-term Price Expectations | -18% | ↓ from -6% |
| 12-month Price Expectations | +33% | ↓ from +43% |
The contradiction between negative near-term expectations (-18%) and positive 12-month outlooks (+33%) creates particular challenges for valuers determining appropriate market sentiment adjustments.[3]
External Factors Dampening Market Confidence
Capital Economics analysis identified geopolitical events, particularly developments in the Middle East, as contributing factors to the dampened buyer sentiment observed in February.[4] These macro-economic uncertainties affect valuation confidence intervals and risk assessments, particularly for commercial building surveys and investment property valuations.
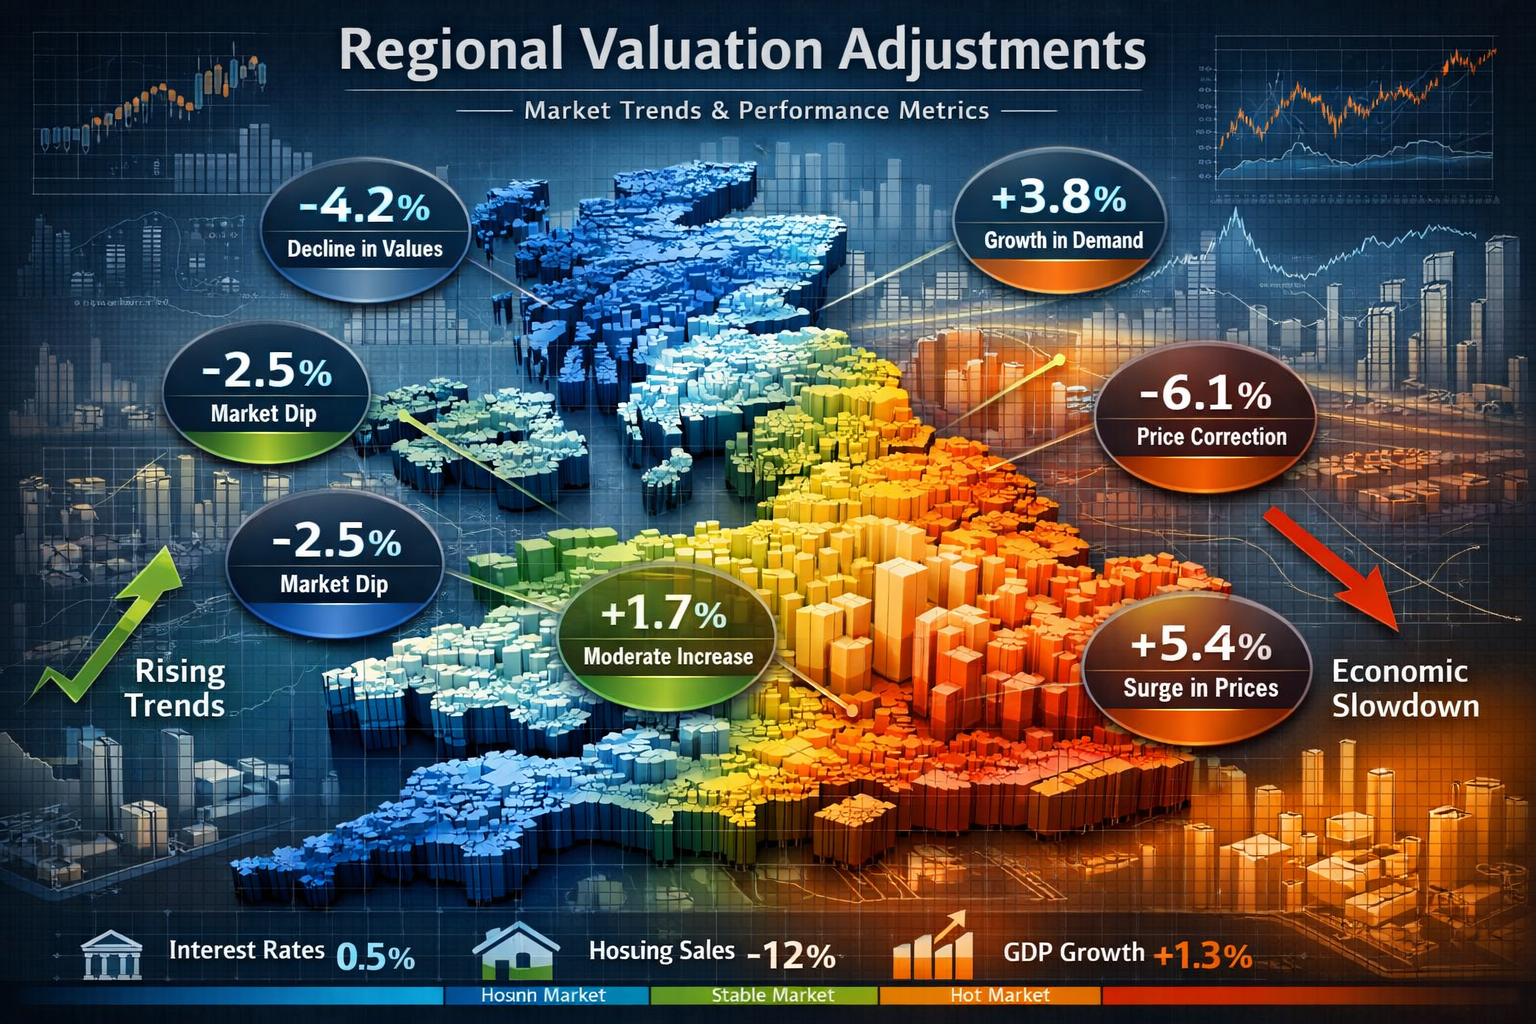
Regional Valuation Adjustments for RICS February 2026 Market Survey Insights
The most striking feature of the February 2026 survey data is the pronounced regional divergence in price movements. Valuers must now apply location-specific adjustments that reflect dramatically different market conditions across the UK.
London and South East: Significant Downward Pressure
London experienced the most severe price weakness with a net balance of -40%, representing a dramatic shift in the capital's market dynamics.[1] The South East followed with -24%, while East Anglia recorded -26%.
Critical valuation implications for London properties:
- 🔴 12-month outlook collapsed from +56% to just +7%, indicating a sharp cooling in confidence
- 🔴 Comparable evidence from Q4 2025 and Q1 2026 may overstate current market values
- 🔴 Time adjustments require careful calibration to reflect rapid sentiment shifts
- 🔴 Location premiums within London boroughs showing increased variation
For professionals conducting property valuations in Canterbury and the wider South East, these regional pressures necessitate conservative approaches to market value assessments, particularly for properties reliant on London commuter demand.
Northern Regions: Relative Resilience
In stark contrast, Northern Ireland, Scotland, and the North West of England reported firmer price trends, maintaining positive or neutral momentum.[1] This creates opportunities for valuers to identify regional value differentials that may not be captured in automated valuation models (AVMs).
Adjustment considerations for northern properties:
- ✅ Greater weight to local comparable evidence over national trends
- ✅ Recognition of relative affordability supporting sustained demand
- ✅ Acknowledgment of different economic drivers than southern markets
- ✅ Careful assessment of local employment and demographic factors
Implementing Practical Valuation Adjustments for RICS February 2026 Market Survey Insights
Professional valuers must translate survey data into practical adjustments that produce defensible market valuations. The February 2026 RICS insights require specific methodological adaptations.
Time-Based Adjustments in Rapidly Changing Markets
With buyer enquiries falling sharply from -15% to -26% in just one month, the temporal relevance of comparable evidence has decreased significantly.[1] Valuers conducting RICS Building Surveys Level 3 assessments must implement robust time adjustment protocols.
Recommended time adjustment framework:
- Comparable evidence age thresholds: Prioritize transactions from the past 8-12 weeks over older comparables
- Monthly adjustment rates: Apply 0.5-1.5% monthly adjustments (positive or negative) based on regional trend data
- Sentiment weighting: Incorporate surveyor sentiment indices alongside transaction evidence
- Forward-looking adjustments: Consider 12-month expectations (+33%) when valuing for long-term hold scenarios
Location Premium Adjustments
The extreme variation between London (-40%) and northern regions requires sophisticated location adjustment methodologies that go beyond simple regional multipliers.
Location adjustment best practices:
- 📍 Micro-location analysis: Assess specific postcode performance rather than relying on broad regional classifications
- 📍 Commuter connectivity: Adjust for transport links to employment centers experiencing different market conditions
- 📍 Local supply-demand dynamics: Consider new instruction levels (+2% nationally) at the local authority level
- 📍 Neighborhood trajectory: Evaluate whether specific areas are outperforming or underperforming regional trends
Transaction Volume Adjustments
Agreed sales remained subdued at -12% net balance, indicating limited transaction momentum.[1] Low transaction volumes reduce the reliability of comparable evidence and may require alternative valuation approaches.
Strategies for low-liquidity markets:
- Use broader geographic search parameters while applying appropriate location adjustments
- Incorporate asking price analysis alongside achieved prices, with suitable discounting
- Reference rental evidence converted through yield analysis for investment properties
- Consider cost approach as supporting methodology for unique properties with limited comparables
- Apply increased uncertainty ranges in valuation reports to reflect market conditions
Sentiment-Based Confidence Intervals
The divergence between near-term (-18%) and 12-month (+33%) price expectations creates uncertainty that should be reflected in valuation confidence intervals.[3]
For capital gains tax valuations and other formal assessments, consider:
- Widening confidence bands from typical ±5% to ±7-10% in high-uncertainty regions
- Scenario analysis presenting pessimistic, base, and optimistic valuations
- Explicit assumption documentation regarding market direction and timing
- Regular revaluation recommendations for portfolio holdings in volatile regions
Rental Market Valuation Adjustments for RICS February 2026 Market Survey Insights
The rental sector presents distinct valuation challenges in February 2026, with acute supply shortages creating upward price pressure despite broader market weakness.
Supply-Demand Imbalance
Landlord instructions remained firmly negative at -27%, while tenant demand held stable at +2%, creating severely imbalanced market conditions.[3] This supply constraint supports higher rental valuations even as sales market values face downward pressure.
Rental valuation adjustments:
- ⬆️ Rental growth expectations: A net balance of +20% anticipated rent increases over three months[1]
- ⬆️ Yield compression: Limited supply may justify lower yield assumptions for rental valuations
- ⬆️ Tenant quality: Strong demand enables landlords to be more selective, potentially reducing void periods
- ⬆️ Regulatory impact: Consider upcoming legislative changes affecting landlord supply decisions
Investment Property Valuations
For professionals conducting probate valuations or investment appraisals, the rental market dynamics create opportunities for value preservation despite sales market weakness.
Investment valuation considerations:
| Factor | Impact on Valuation | Adjustment Direction |
|---|---|---|
| Rental growth expectations | Strong (+20%) | Positive |
| Sales market weakness | Moderate (-12%) | Negative |
| Supply constraints | Severe (-27% instructions) | Positive |
| Transaction volumes | Low (-12% agreed sales) | Uncertainty increase |
| Net effect | Rental properties outperforming | Modest positive |
Surveyor Strategies for Accurate Valuations in Uncertain Conditions
Professional surveyors must adapt their methodologies to deliver accurate, defensible valuations despite the mixed signals evident in the February 2026 RICS data.
Enhanced Due Diligence Protocols
When conducting RICS home surveys and valuations, implement enhanced verification procedures:
- Multiple data sources: Cross-reference RICS survey data with Land Registry statistics, local agent intelligence, and mortgage lender indices
- Peer review: Establish internal review processes for valuations in high-volatility regions
- Assumption documentation: Explicitly state all market assumptions, particularly regarding direction and timing
- Client communication: Clearly explain the basis of valuations and inherent uncertainties
Regional Expertise Development
The extreme regional divergence in February 2026 data emphasizes the importance of local market knowledge. Valuers should:
- 🎯 Develop regional specializations rather than attempting national coverage
- 🎯 Maintain local agent networks for real-time market intelligence
- 🎯 Track micro-market indicators at postcode and neighborhood levels
- 🎯 Attend local property events to understand sentiment beyond statistical data
Technology-Enhanced Valuation Methodologies
Modern valuation technology can help navigate mixed market signals:
- Automated comparable selection with sophisticated filtering for recency, location, and property characteristics
- Sentiment analysis tools that process multiple data sources including RICS surveys
- Scenario modeling software to present multiple valuation outcomes under different market assumptions
- Geographic information systems (GIS) to visualize and analyze regional price variations
Specialist Survey Integration
For properties with specific defects or characteristics, integrate findings from specialist defect surveys and structural engineering assessments into valuation adjustments.
Market uncertainty may amplify the value impact of:
- Structural issues requiring significant remediation (buyers more risk-averse in weak markets)
- Damp problems identified through damp surveys (reduced buyer tolerance for defects)
- Roof condition assessed via roof surveys (capital expenditure concerns heightened)
- Subsidence risks detected in subsidence surveys (insurance and mortgage implications magnified)
Forward-Looking Valuation Considerations
While the February 2026 RICS data shows immediate market weakness, the moderately positive 12-month outlook (+33%) suggests valuers must balance current conditions against anticipated recovery.[3]
Scenario-Based Valuation Approaches
For ATED valuations and other purposes requiring forward-looking assessments, consider scenario modeling:
Pessimistic scenario (25% probability):
- Continued demand weakness beyond Q2 2026
- Regional divergence intensifies
- Transaction volumes remain suppressed
- Valuation impact: -5% to -10% from current levels
Base case scenario (50% probability):
- Gradual demand recovery from Q3 2026
- Regional patterns persist but moderate
- Transaction volumes slowly improve
- Valuation impact: -2% to +3% from current levels
Optimistic scenario (25% probability):
- Strong demand recovery by summer 2026
- Regional convergence begins
- Transaction volumes normalize
- Valuation impact: +5% to +8% from current levels
Monitoring and Revaluation Protocols
Given the rapid market changes evident between January and February 2026, establish regular monitoring protocols:
- Monthly data review: Track subsequent RICS surveys and other market indicators
- Quarterly revaluation triggers: Establish thresholds for mandatory revaluation of portfolio holdings
- Client notification systems: Inform clients when market movements exceed confidence intervals
- Assumption validation: Regularly test valuation assumptions against emerging market evidence
Professional Standards and Compliance
The mixed signals in the February 2026 RICS data emphasize the importance of adhering to professional valuation standards, particularly the RICS Valuation – Global Standards (Red Book).
Uncertainty and Material Valuation Uncertainty Clauses
When market conditions create significant uncertainty, valuers should consider including Material Valuation Uncertainty (MVU) declarations in their reports, particularly for:
- Properties in regions experiencing extreme volatility (e.g., London at -40%)
- Unique properties with limited comparable evidence
- Valuations for lending purposes where market liquidity is severely constrained
- Portfolio valuations spanning multiple regions with divergent trends
The RICS guidance on valuation in extreme conditions provides frameworks for addressing uncertainty.[5]
Documentation and Audit Trails
Robust documentation becomes even more critical when navigating mixed market signals:
- ✍️ Comparable selection rationale: Document why specific comparables were selected or rejected
- ✍️ Adjustment calculations: Show detailed workings for all time, location, and condition adjustments
- ✍️ Market data sources: Reference specific RICS survey data points and other sources
- ✍️ Assumption justification: Explain the basis for all market assumptions and expectations
Conclusion
The Valuation Adjustments for RICS February 2026 Market Survey Insights: Navigating Mixed Regional Signals require property professionals to adopt sophisticated, nuanced approaches that move beyond simple national trend analysis. With buyer demand declining sharply to -26%, London experiencing -40% price pressure, yet 12-month expectations remaining positive at +33%, valuers face a complex landscape demanding enhanced methodologies and rigorous professional judgment.
Key action steps for valuation professionals:
- Implement region-specific adjustment protocols that reflect the extreme divergence between London/South East and northern markets
- Enhance comparable evidence verification with stricter recency requirements and broader geographic searches where necessary
- Widen confidence intervals to reflect increased market uncertainty, particularly in high-volatility regions
- Integrate rental market dynamics into investment property valuations, recognizing the supply-demand imbalance supporting rental values
- Establish monitoring systems to track subsequent RICS surveys and trigger revaluations when market conditions shift materially
- Strengthen documentation practices to ensure all adjustments and assumptions are defensible under professional scrutiny
For property owners, buyers, and investors, engaging registered RICS valuers with demonstrated expertise in navigating uncertain market conditions has never been more important. The February 2026 data underscores that accurate valuation in 2026 requires not just technical competence, but also sophisticated market interpretation skills and the professional judgment to balance conflicting signals.
As markets continue to evolve through 2026, regular consultation with qualified professionals and ongoing monitoring of RICS survey data will be essential for making informed property decisions in an environment where regional variations and temporal changes can significantly impact asset values.
References
[1] Uk Residential Survey February 2026 – https://www.rics.org/news-insights/uk-residential-survey-february-2026
[2] Uk Economy Property Update February 2026 – https://www.rics.org/content/dam/ricsglobal/documents/market-surveys/uk-economy-property-update-february-2026.pdf
[3] Uk Residential Market Survey February 2026 – https://www.rics.org/content/dam/ricsglobal/documents/market-surveys/uk-residential-market-survey/UK-Residential-Market-Survey_February-2026.pdf
[4] Uk Rics Residential Market Survey Feb 2026 – https://www.capitaleconomics.com/publications/uk-housing-market-update/uk-rics-residential-market-survey-feb-2026
[5] Real Estate Valuation Extreme Conditions – https://ww3.rics.org/uk/en/journals/property-journal/real-estate-valuation-extreme-conditions.html
[6] Building Survey Market Sentiment In Early 2026 Navigating Regional Price Divergence And Buyer Uncertainty – https://nottinghillsurveyors.com/blog/building-survey-market-sentiment-in-early-2026-navigating-regional-price-divergence-and-buyer-uncertainty