Picture a property developer standing at a construction site, holding a tablet that instantly reveals not just property boundaries, but underground utilities, zoning restrictions, flood zones, environmental constraints, and future land use plans—all layered together in a single, interactive map. This isn't science fiction. It's the reality of GIS Integration for Smarter Property Boundary and Zoning Analysis in 2026, a technological revolution that's transforming how professionals approach land development, property assessment, and urban planning.
Geographic Information Systems (GIS) have evolved from specialized mapping tools into comprehensive decision-making platforms that combine spatial data with powerful analytics. For surveyors, property developers, planners, and local authorities, GIS integration represents a fundamental shift in how property boundaries are defined, zoning regulations are analyzed, and development decisions are made. By overlaying multiple datasets—from utility infrastructure to land use trends—GIS creates visual intelligence that was impossible to achieve with traditional surveying methods.
Key Takeaways
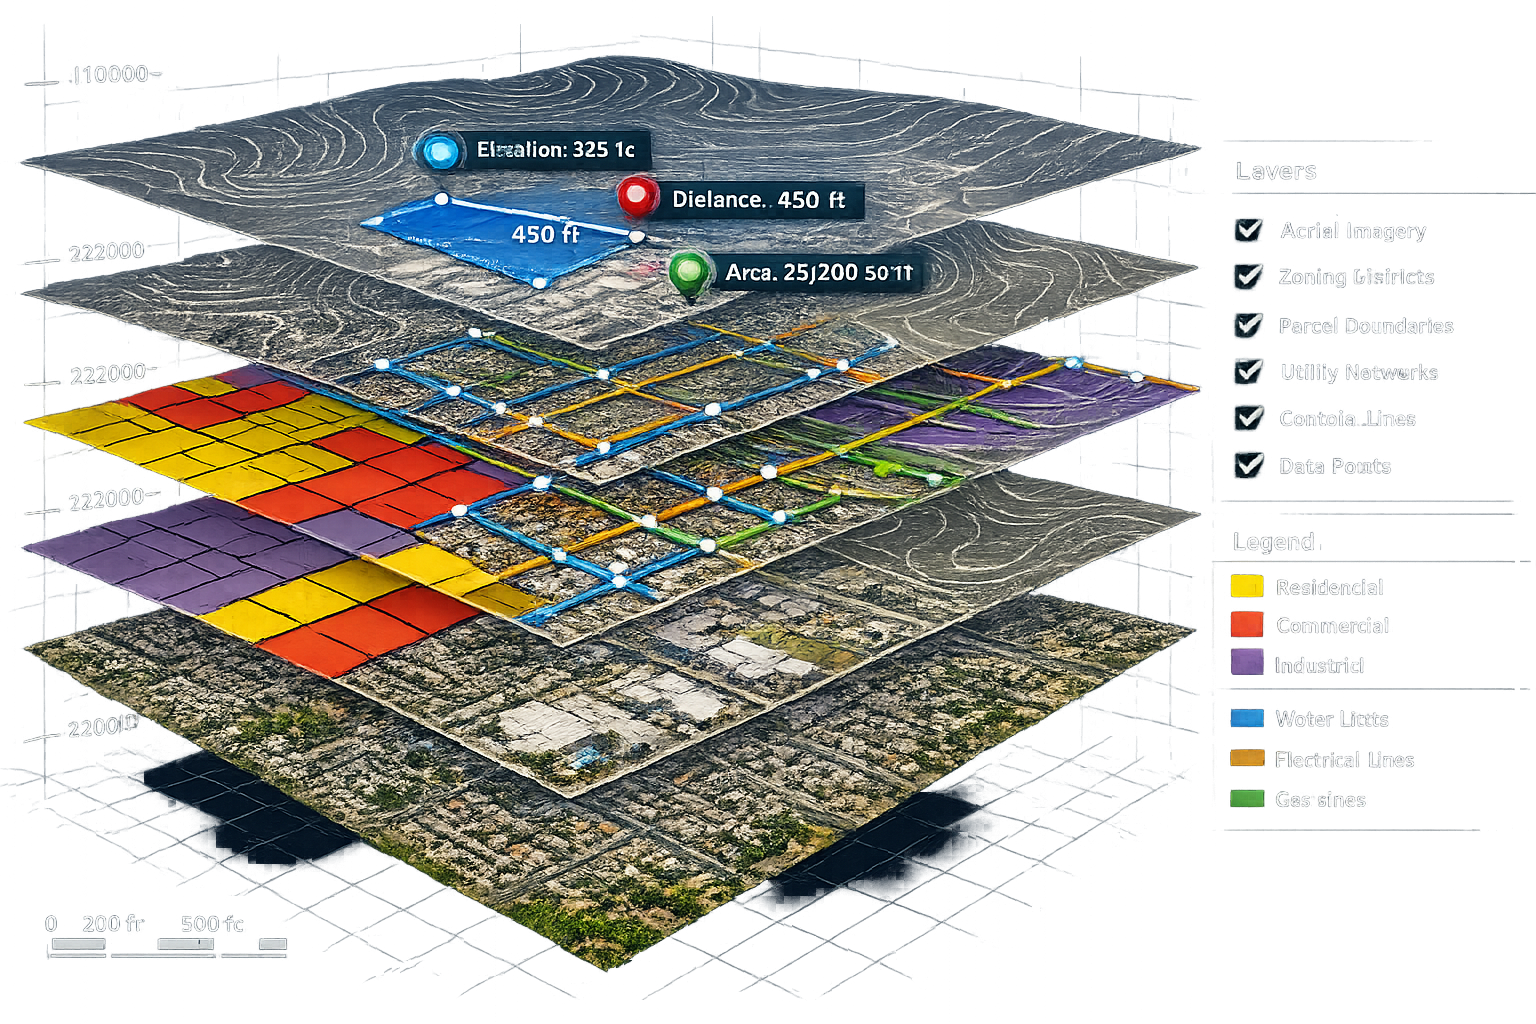
- 📊 Multi-Layer Data Visualization: GIS integration combines property boundaries, zoning maps, utility networks, and aerial imagery into unified visual platforms that enhance decision-making accuracy
- ⚡ Efficiency and Accuracy: Modern GIS systems reduce surveying time by 40-60% while significantly improving boundary determination and zoning compliance verification
- 🏗️ Development Project Essential: GIS overlays provide critical insights for site selection, environmental impact assessment, and regulatory compliance in modern development projects
- 🔗 Statewide Data Access: Platforms like MapWise and county-level GIS portals provide standardized access to parcel data, zoning information, and future land use plans across entire regions[1][6]
- 🎯 Real-Time Decision Support: Interactive GIS tools enable stakeholders to visualize scenarios, identify conflicts, and make informed decisions before physical work begins
Understanding GIS Integration for Property and Zoning Analysis
What Is GIS Integration?
Geographic Information Systems integration refers to the process of combining multiple spatial datasets, analytical tools, and visualization capabilities into a cohesive platform for analyzing geographic information. In the context of property boundary and zoning analysis, GIS integration brings together:
- Parcel boundary data from land registry systems
- Zoning classifications and land use designations
- Utility infrastructure locations (water, sewer, electrical, gas)
- Topographic information including elevation and terrain features
- Aerial and satellite imagery for visual context
- Environmental constraints such as wetlands and flood zones
- Future development plans and comprehensive land use maps
When these datasets are integrated within a GIS platform, professionals gain the ability to perform complex spatial analyses that would be impossible using traditional paper maps or isolated data sources. The system doesn't just display information—it enables users to query relationships, measure distances, calculate areas, and model scenarios in real-time.
The Evolution of Property Boundary Surveying
Traditional boundary surveys relied heavily on physical measurements, historical deed descriptions, and manual calculations. Surveyors would spend days in the field taking measurements, then return to offices to manually draft boundary maps. This process was time-consuming, prone to human error, and offered limited ability to visualize how property boundaries related to other geographic features.
The integration of GIS technology has revolutionized this workflow. Modern surveyors now use GPS-enabled equipment that feeds data directly into GIS platforms, where boundaries are instantly visualized against aerial imagery, existing parcel maps, and zoning overlays. This transformation has made boundary determination faster, more accurate, and significantly more informative for clients and stakeholders.
How GIS Enhances Zoning Analysis
Zoning analysis traditionally involved consulting physical zoning maps, reading complex ordinance documents, and making manual interpretations about what activities were permitted on specific parcels. This process was often confusing and left room for misinterpretation.
GIS Integration for Smarter Property Boundary and Zoning Analysis transforms this experience by:
- Visual Clarity: Color-coded zoning districts displayed on interactive maps make it immediately obvious what regulations apply to any location
- Instant Information Access: Clicking on a parcel reveals zoning classification, permitted uses, setback requirements, and height restrictions
- Proximity Analysis: Automatically identifying nearby zoning districts that might impact development plans
- Historical Context: Viewing zoning changes over time to understand regulatory trends
- Future Planning: Accessing future land use maps that show planned zoning changes[1]
According to Florida's comprehensive zoning framework, proper zoning analysis requires understanding multiple regulatory layers including state, county, and municipal regulations[2]. GIS platforms make navigating this complexity manageable by presenting all relevant information in a single, intuitive interface.
The Technology Behind GIS Integration for Smarter Property Boundary and Zoning Analysis
Core GIS Components and Architecture
Modern GIS platforms for property and zoning analysis consist of several interconnected components:
Data Storage and Management
- Spatial databases that store geographic coordinates and geometry
- Attribute databases containing property information, ownership records, and zoning details
- Raster data repositories for aerial imagery and satellite photos
- Metadata systems documenting data sources, accuracy, and update schedules
Data Processing and Analysis
- Geoprocessing tools for spatial calculations and transformations
- Topology engines ensuring geometric accuracy and consistency
- Query systems enabling complex searches across multiple datasets
- Statistical analysis modules for trend identification and pattern recognition
Visualization and User Interface
- Interactive mapping interfaces with zoom, pan, and layer control
- Symbology engines for color-coding and visual representation
- Labeling systems for annotating features and measurements
- 3D visualization capabilities for terrain and building modeling
Data Sources and Integration Methods
The power of GIS Integration for Smarter Property Boundary and Zoning Analysis comes from bringing together diverse data sources:
| Data Type | Common Sources | Update Frequency | Typical Accuracy |
|---|---|---|---|
| Property Boundaries | County Assessor, Land Registry | Annually | ±0.5-2 feet |
| Zoning Districts | Planning Departments | Quarterly | Parcel-level |
| Utility Networks | Utility Companies, Public Works | Ongoing | ±2-5 feet |
| Aerial Imagery | Satellite, Aircraft, Drones | 6-12 months | 6-12 inch resolution |
| Topography | LIDAR, Survey Data | 2-5 years | ±0.1-1 foot vertical |
| Environmental Data | State/Federal Agencies | Variable | Feature-dependent |
In Florida, the MapWise GIS Mapping System provides statewide access to county and city future land use and zoning maps, parcel data, and aerial imagery[1]. This standardized approach ensures consistency across jurisdictions and enables regional analysis that was previously impossible.
County-level systems like Osceola County's GIS Portal and Brevard County's GIS Open Data Hub provide even more detailed local information, including planning and zoning data, flood zones, and commission district boundaries[5][6]. These systems demonstrate how GIS integration operates at multiple governmental levels, each adding value to the overall data ecosystem.
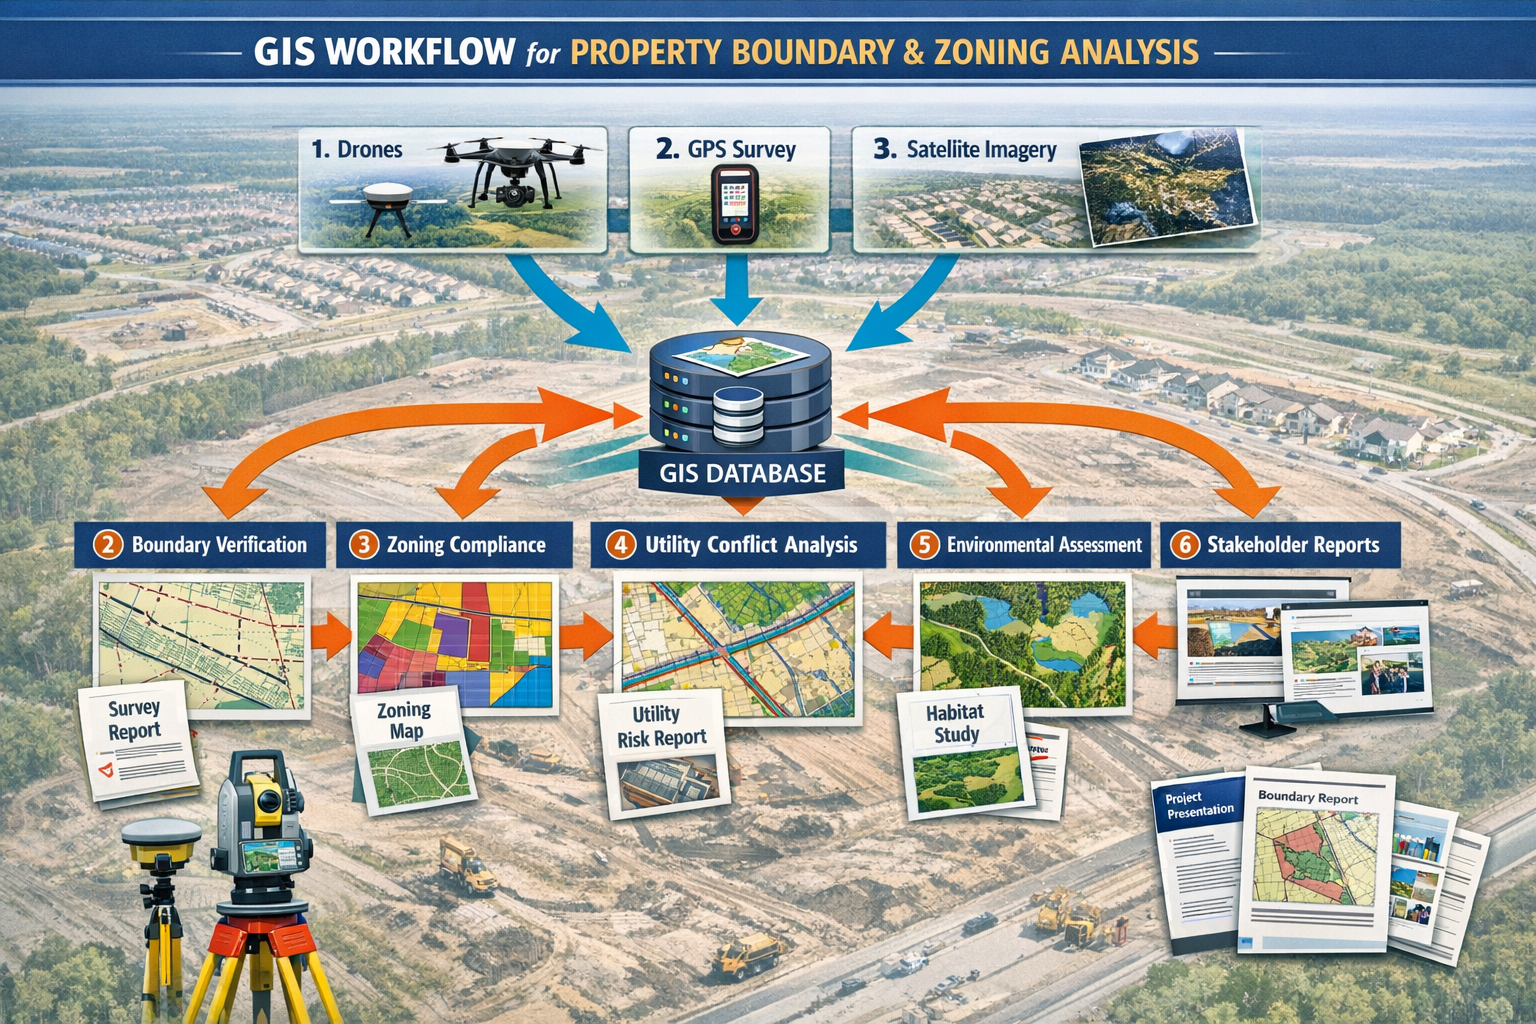
Integration with Surveying Equipment
Modern surveying equipment seamlessly integrates with GIS platforms, creating a continuous workflow from field data collection to final analysis:
GPS/GNSS Receivers: High-precision positioning devices that achieve centimeter-level accuracy, directly recording boundary points with geographic coordinates that import into GIS systems without manual data entry.
Total Stations: Electronic theodolites that measure angles and distances, with many models featuring built-in data collectors that export directly to GIS-compatible formats.
Drone/UAV Systems: Unmanned aerial vehicles equipped with cameras and LIDAR sensors that create detailed aerial imagery and 3D terrain models, processed through photogrammetry software that outputs GIS-ready datasets.
Mobile GIS Applications: Tablet and smartphone apps that allow field personnel to view GIS data, collect new observations, and update records in real-time while on-site.
This integration eliminates the traditional disconnect between field surveying and office analysis, enabling professionals to make informed decisions even while standing on the property itself. When conducting building surveys or property inspections, having instant access to boundary, zoning, and utility information through mobile GIS applications dramatically improves efficiency and accuracy.
Practical Applications of GIS Integration in Property Development
Site Selection and Feasibility Analysis
One of the most valuable applications of GIS Integration for Smarter Property Boundary and Zoning Analysis occurs during the early stages of property development—site selection and feasibility assessment. Developers and investors can use GIS to rapidly evaluate multiple potential sites against numerous criteria:
Zoning Compatibility 🎯
GIS platforms allow users to overlay proposed development types against current zoning maps, instantly identifying which sites permit the intended use. For commercial development, this might mean filtering all parcels zoned for commercial or mixed-use, then narrowing results based on size requirements and location preferences.
Infrastructure Availability 🔌
Utility overlay maps reveal which sites have access to water, sewer, electrical, and telecommunications infrastructure. Distance calculations show how far new connections would need to extend, directly impacting development costs. This analysis can eliminate sites that appear attractive but would require prohibitively expensive infrastructure extensions.
Environmental Constraints 🌳
Environmental data layers identify wetlands, endangered species habitats, steep slopes, and other features that might restrict development. Flood zone overlays show which portions of a site fall within FEMA-designated flood hazards, affecting both development costs and insurance requirements. The Florida Department of Environmental Protection maintains extensive GIS data on environmental features that integrate with local planning systems[9].
Regulatory Compliance ⚖️
Beyond basic zoning, GIS can display overlay districts, historic preservation zones, airport approach zones, and other regulatory constraints. For example, proposed data center legislation in Florida would create new regulatory frameworks affecting land use and zoning for specific development types[4]. GIS platforms can be updated to reflect these changes, ensuring developers work with current regulations.
Market Analysis 📈
Demographic data, traffic counts, competitor locations, and other market factors can be mapped alongside property boundaries, creating comprehensive market feasibility visualizations. Proximity analysis tools measure distances to target customer populations, transportation corridors, and complementary businesses.
Boundary Determination and Dispute Resolution
Property boundary disputes are among the most common and contentious issues in real estate. GIS Integration for Smarter Property Boundary and Zoning Analysis provides powerful tools for resolving these conflicts:
Historical Boundary Research
GIS platforms can store and display historical parcel maps, showing how boundaries have evolved over time. By overlaying current survey data against historical records, surveyors can identify discrepancies and trace the origin of boundary confusion.
Visual Evidence Presentation
When boundary disputes reach legal proceedings, GIS-generated maps provide compelling visual evidence. Overlaying survey measurements, aerial imagery, physical features, and deed descriptions creates clear, understandable presentations that help judges, attorneys, and property owners understand complex spatial relationships.
Precision Measurement and Verification
Modern GIS tools enable surveyors to calculate areas, distances, and angles with extreme precision. When integrated with GPS survey data, these calculations provide legally defensible boundary determinations. Professional chartered surveyors increasingly rely on GIS-integrated workflows to ensure accuracy and documentation quality.
Neighboring Parcel Context
GIS displays show how a disputed boundary relates to surrounding parcels, roads, and physical features. This context often reveals logical boundary interpretations that might not be obvious when examining a single property in isolation.
Utility Mapping and Infrastructure Planning
Utility conflicts represent one of the most expensive and dangerous problems in development projects. Striking an underground utility line during excavation can cause injuries, service disruptions, environmental damage, and significant project delays. GIS Integration for Smarter Property Boundary and Zoning Analysis addresses this challenge through comprehensive utility mapping:
Multi-Utility Visualization 🗺️
GIS platforms display water, sewer, stormwater, electrical, gas, telecommunications, and other utility networks on a single map. Color-coding and symbology differentiate utility types, while depth information (when available) helps planners understand vertical relationships.
Conflict Detection
Before design work begins, GIS analysis can identify potential conflicts between proposed structures and existing utilities. Automated tools measure clearances and flag locations where utilities might need relocation or protection measures.
Coordination and Stakeholder Communication
Utility companies, developers, contractors, and local authorities all need access to utility information. Web-based GIS platforms provide a common reference that all stakeholders can access, reducing miscommunication and coordination failures.
As-Built Documentation
After construction, GIS systems provide the ideal platform for documenting as-built utility locations. This creates an accurate record for future maintenance, expansion, and development projects.
County systems like Brevard County's GIS Open Data Hub provide parcel boundaries, digital section maps, and infrastructure data that support comprehensive utility planning[5]. This integration of property and utility information in a single platform represents a significant advancement over traditional separated record systems.
Zoning Compliance and Permitting
The permitting process for property development involves demonstrating compliance with numerous zoning regulations. GIS integration streamlines this process:
Automated Compliance Checking ✅
Modern GIS platforms can automatically check proposed developments against zoning requirements. For example, the system can verify that a proposed building:
- Falls within the permitted zoning district
- Meets setback requirements from all property lines
- Complies with height restrictions
- Provides adequate parking based on use type
- Maintains required green space percentages
Variance Analysis
When projects require zoning variances, GIS tools help demonstrate the specific nature of the request. Measurement tools show exactly how much a proposed structure exceeds setback requirements, while context maps illustrate how the variance relates to neighboring properties.
Public Notice and Stakeholder Review
Many jurisdictions require notifying property owners within a certain distance of proposed developments. GIS buffer tools automatically identify all parcels within the notification radius, generating mailing lists and creating maps for public hearings.
Permit Tracking and History
GIS databases can store permit history for every parcel, creating a comprehensive record of approvals, denials, and conditions. This information helps planners understand development patterns and ensures consistency in decision-making.
Advanced GIS Capabilities for Land Use and Development Analysis

Temporal Analysis and Land Use Trends
One of the most powerful yet underutilized capabilities of GIS Integration for Smarter Property Boundary and Zoning Analysis is temporal analysis—examining how property characteristics and land use patterns change over time. This capability provides insights that static maps cannot reveal:
Zoning Change Tracking 📊
By maintaining historical zoning data, GIS platforms can display how zoning districts have evolved. Animated visualizations show the expansion of commercial zones, the creation of mixed-use districts, or the preservation of residential areas. This historical perspective helps planners understand regulatory trends and predict future changes.
Development Pattern Analysis
Overlaying building permit data, subdivision approvals, and construction timelines reveals spatial and temporal development patterns. Planners can identify which areas are experiencing rapid growth, which zones remain underdeveloped, and how development spreads from core areas to periphery.
Property Value Trends
Integration with assessment data enables visualization of property value changes over time. Heat maps show appreciation patterns, helping investors identify emerging markets and planners understand the economic impacts of zoning decisions.
Infrastructure Capacity Planning
By analyzing development trends alongside utility capacity data, planners can predict when infrastructure upgrades will be needed. GIS models can forecast demand based on approved but not yet built developments, enabling proactive infrastructure planning.
The Florida Department of Revenue's 2026 Assessment Roll Edit Guide demonstrates how parcel-level geographical information is maintained for property assessment purposes[8]. This standardized data structure enables temporal analysis across counties and supports regional planning initiatives.
3D Visualization and Building Mass Modeling
While traditional GIS focused on two-dimensional mapping, modern platforms increasingly incorporate three-dimensional visualization capabilities that transform property and zoning analysis:
Terrain Modeling ⛰️
LIDAR data and digital elevation models create accurate 3D representations of topography. Developers can visualize how proposed structures will relate to slopes, valleys, and elevation changes—critical information for grading plans, drainage design, and visual impact assessment.
Building Mass Studies
3D GIS tools allow planners to create building mass models that show how proposed structures will appear in context. These models can verify compliance with height restrictions, assess shadow impacts on neighboring properties, and evaluate aesthetic compatibility with surrounding development.
Viewshed Analysis
For projects where visual impact matters—telecommunications towers, wind turbines, or tall buildings—viewshed analysis shows which locations will have sight lines to the proposed structure. This helps assess community impact and plan mitigation measures.
Solar Access and Shadow Studies
3D models combined with solar position calculations can predict shadow patterns throughout the day and across seasons. This information matters for solar panel installations, outdoor amenity planning, and ensuring neighboring properties maintain adequate sunlight.
Scenario Planning and What-If Analysis
Perhaps the most valuable decision-making capability of GIS integration is scenario planning—the ability to model different development options and compare their impacts:
Alternative Site Layouts 🏘️
Developers can create multiple site plan scenarios within GIS, each showing different building configurations, parking arrangements, and open space allocations. Comparative analysis reveals which scenario maximizes density while meeting setback requirements, provides optimal traffic circulation, or preserves the most desirable natural features.
Zoning Change Impact Modeling
Before proposing zoning amendments, planners can model the potential impacts. What if a residential zone were changed to mixed-use? GIS analysis can estimate additional traffic generation, parking demand, infrastructure load, and economic impacts based on typical development patterns.
Build-Out Analysis
GIS tools can model complete build-out scenarios—what would happen if every parcel developed to the maximum density allowed by current zoning? This analysis helps planners understand whether infrastructure capacity matches zoning potential and whether comprehensive plan goals align with zoning reality.
Environmental Impact Scenarios
Modeling different development scenarios against environmental data layers reveals which options minimize wetland impacts, preserve wildlife corridors, or maintain natural drainage patterns. This supports environmentally sensitive development planning.
Implementing GIS Integration: Practical Considerations for Professionals
Selecting the Right GIS Platform
The GIS market offers solutions ranging from enterprise-level platforms to specialized property analysis tools. Selecting the appropriate system requires evaluating several factors:
Scale and Scope 📏
- Enterprise GIS: Organizations managing data for entire counties or regions need robust platforms like Esri ArcGIS Enterprise or open-source alternatives like QGIS with PostGIS databases
- Project-Level GIS: Individual surveying firms or development companies might prefer desktop solutions like ArcGIS Pro or cloud-based platforms with subscription pricing
- Mobile GIS: Field personnel need tablet-compatible applications with offline capabilities for site work
Data Compatibility
The platform must import and export data in formats compatible with other systems. Common formats include:
- Shapefiles (SHP) for vector data
- GeoJSON for web-based applications
- KML/KMZ for Google Earth integration
- GeoTIFF for raster imagery
- CAD formats (DWG, DXF) for engineering drawings
Analysis Capabilities
Different platforms offer varying analytical tools. Essential capabilities for property and zoning analysis include:
- Buffer and proximity analysis
- Overlay operations (union, intersect, clip)
- Area and distance calculations
- Spatial queries and selection
- Geocoding and address matching
User Interface and Learning Curve
The most powerful GIS platform provides no value if users cannot operate it effectively. Consider the technical expertise of intended users and the availability of training resources.
Data Acquisition and Quality Management
The foundation of effective GIS Integration for Smarter Property Boundary and Zoning Analysis is high-quality, current data. Establishing reliable data sources and maintaining data quality requires systematic approaches:
Official Data Sources 🏛️
- County Assessor/Recorder Offices: Parcel boundaries, ownership records, legal descriptions
- Planning Departments: Zoning maps, comprehensive plans, overlay districts
- Public Works Departments: Utility infrastructure, road centerlines, right-of-way
- State Agencies: Environmental features, floodplains, protected areas[9]
- Federal Sources: USGS topographic data, FEMA flood maps, Census demographics
Data Quality Verification
Not all GIS data is equally accurate. Establish verification procedures:
- Compare data from multiple sources to identify discrepancies
- Field-verify critical features using GPS equipment
- Document data accuracy standards and limitations
- Maintain metadata describing data sources, dates, and quality measures
Update Schedules
GIS data becomes outdated as conditions change. Establish update protocols:
- Parcel boundaries: Update after subdivisions, lot line adjustments, or annexations
- Zoning: Update immediately following zoning amendments
- Aerial imagery: Update annually or biannually
- Utility infrastructure: Update after construction projects
Data Standardization
When integrating data from multiple sources, standardization ensures compatibility:
- Consistent coordinate systems (State Plane, UTM, or local systems)
- Uniform attribute naming conventions
- Standardized classification schemes
- Common data formats
Integration with Existing Workflows
Successfully implementing GIS integration requires thoughtful incorporation into existing professional workflows rather than treating it as a separate system:
Survey Workflow Integration 📐
Traditional surveying workflows move from research to field work to drafting to delivery. GIS integration enhances each stage:
- Research Phase: Query GIS databases for existing parcel data, previous surveys, and regulatory information before fieldwork
- Field Phase: Use mobile GIS to view existing data on-site, collect new data with GPS-enabled equipment, and update records in real-time
- Analysis Phase: Import field data into GIS for boundary calculation, area computation, and quality verification
- Deliverable Phase: Generate maps, reports, and visualizations directly from GIS, ensuring consistency and accuracy
When conducting specialized services like structural surveys or property certification, GIS integration provides valuable context about property characteristics, zoning constraints, and surrounding conditions.
Development Planning Integration 🏗️
Development projects involve multiple phases where GIS adds value:
- Acquisition: Site evaluation using GIS analysis of zoning, utilities, and environmental constraints
- Due Diligence: Detailed investigation of title, boundaries, easements, and regulatory requirements
- Design: Site planning with GIS-based constraint mapping and scenario modeling
- Permitting: Compliance verification and permit application documentation
- Construction: As-built documentation and utility coordination
- Marketing: Property visualization and amenity mapping for sales materials
Valuation Integration 💰
Property valuation increasingly relies on spatial analysis. GIS integration enhances property valuation by:
- Identifying comparable properties based on location, zoning, and characteristics
- Analyzing market trends spatially to understand location value factors
- Visualizing property features that impact value
- Documenting highest and best use analysis with zoning overlays
Training and Skill Development
Effective use of GIS Integration for Smarter Property Boundary and Zoning Analysis requires ongoing skill development:
Technical Skills 💻
- GIS software operation (interface navigation, tool usage, data management)
- Spatial data concepts (coordinate systems, projections, topology)
- Data analysis techniques (queries, overlays, measurements)
- Cartographic principles (symbology, labeling, layout design)
Domain Knowledge 📚
- Property law and boundary determination principles
- Zoning regulations and land use planning concepts
- Surveying standards and accuracy requirements
- Environmental regulations and constraints
Training Resources
- Vendor-provided training (Esri, Trimble, Bentley)
- Professional organization courses (URISA, ASPRS)
- Online learning platforms (Coursera, Udemy, LinkedIn Learning)
- Peer learning and user groups
The Future of GIS Integration in Property and Zoning Analysis
Emerging Technologies and Trends
The field of GIS Integration for Smarter Property Boundary and Zoning Analysis continues to evolve rapidly. Several emerging technologies will shape its future:
Artificial Intelligence and Machine Learning 🤖
AI algorithms are beginning to automate complex GIS analysis tasks:
- Automated feature extraction from aerial imagery (building footprints, road networks, vegetation)
- Predictive modeling for development patterns and land use changes
- Intelligent zoning compliance checking that understands regulatory language
- Pattern recognition for identifying property characteristics and anomalies
Real-Time Data Integration ⚡
IoT sensors and connected devices enable real-time spatial data:
- Traffic flow sensors informing development impact analysis
- Environmental monitors tracking air quality, noise, and water conditions
- Utility sensors detecting infrastructure capacity and performance
- Construction progress monitoring through connected equipment
Cloud-Based Collaboration ☁️
Cloud GIS platforms enable unprecedented collaboration:
- Multiple stakeholders accessing and editing shared datasets simultaneously
- Automatic synchronization between field and office systems
- Scalable computing power for complex analysis without local hardware investment
- Public-facing portals providing transparency in planning processes
Augmented Reality Integration 🥽
AR technology brings GIS data into the physical environment:
- Field personnel viewing underground utilities overlaid on actual terrain through AR glasses
- Property boundaries visible through smartphone cameras during site visits
- Proposed building designs visualized in context at actual scale and location
- Interactive zoning information accessible by pointing devices at properties
Regulatory and Standardization Developments
As GIS integration becomes standard practice, regulatory frameworks are evolving to accommodate and leverage these capabilities:
Digital Submission Requirements 📄
More jurisdictions are requiring digital GIS-compatible submissions for:
- Subdivision plats and lot line adjustments
- Site plans and development applications
- As-built surveys and utility documentation
- Environmental impact assessments
The Florida Department of Revenue's standardized GIS edit guide represents this trend toward uniform digital data standards[8]. As these standards spread, interoperability between systems improves and data quality increases.
Automated Permitting Systems 🔄
Some progressive jurisdictions are implementing automated permit review systems that use GIS integration to:
- Instantly check zoning compliance for simple applications
- Flag potential issues requiring human review
- Generate notification lists for adjacent property owners
- Track application status spatially
Open Data Initiatives 🌐
Government transparency movements are making GIS data increasingly accessible. Platforms like Osceola County's GIS Portal and Brevard County's GIS Open Data Hub exemplify this trend[5][6]. Open data initiatives benefit:
- Developers conducting preliminary site analysis
- Researchers studying urban development patterns
- Citizens understanding planning decisions affecting their communities
- Businesses providing location-based services
Sustainability and Smart Growth Applications
GIS Integration for Smarter Property Boundary and Zoning Analysis plays a crucial role in sustainable development and smart growth initiatives:
Transit-Oriented Development 🚇
GIS analysis identifies optimal locations for higher-density development near transit stations by overlaying:
- Transit routes and station locations
- Current zoning and development capacity
- Walkability and pedestrian infrastructure
- Demographic data showing transit-dependent populations
Green Infrastructure Planning 🌱
Environmental GIS layers support sustainable development by:
- Identifying opportunities for green space preservation and connectivity
- Analyzing stormwater management through natural systems
- Mapping urban heat islands to guide tree planting and cooling strategies
- Preserving agricultural land and natural resources
Energy Efficiency and Renewable Energy ☀️
GIS tools support energy-conscious development through:
- Solar potential mapping based on roof orientation, shading, and climate
- Wind resource assessment for renewable energy projects
- Building orientation analysis for passive solar design
- District energy system planning
Climate Adaptation 🌊
As climate change impacts intensify, GIS integration supports adaptation planning:
- Sea level rise modeling and coastal development restrictions
- Flood risk assessment incorporating projected precipitation changes
- Heat resilience planning for vulnerable communities
- Infrastructure vulnerability analysis
Case Studies: GIS Integration in Action
Case Study 1: Large-Scale Residential Development
A development company proposed a 500-acre residential community requiring comprehensive analysis of boundaries, zoning, and infrastructure. GIS Integration for Smarter Property Boundary and Zoning Analysis streamlined the entire process:
Challenge: The site comprised 23 separate parcels with complex boundary histories, multiple zoning designations, significant environmental constraints, and limited existing utility infrastructure.
GIS Solution:
- Integrated historical survey data with current GPS measurements to resolve boundary ambiguities
- Overlaid current zoning against proposed comprehensive plan amendments
- Mapped wetlands, protected species habitats, and required conservation buffers
- Analyzed utility extension requirements and capacity constraints
- Modeled alternative site layouts optimizing density while respecting constraints
Results:
- Reduced planning timeline by 6 months through efficient analysis
- Identified optimal development configuration preserving 40% open space
- Demonstrated regulatory compliance through clear visualizations
- Facilitated stakeholder communication with accessible web maps
- Created comprehensive as-built documentation for future management
Case Study 2: Urban Infill Commercial Project
A commercial developer sought to redevelop an underutilized urban parcel surrounded by existing development, requiring careful analysis of constraints and opportunities.
Challenge: The 2-acre site had unclear boundaries, complex easement arrangements, nearby historic districts, and uncertain utility capacity.
GIS Solution:
- Conducted detailed boundary survey with GPS equipment, integrating results with county parcel data
- Mapped all easements, setbacks, and overlay district requirements
- Analyzed utility networks showing available capacity and connection points
- Created 3D building mass models demonstrating height compliance and shadow impacts
- Performed viewshed analysis from historic district perspectives
Results:
- Identified 15% additional developable area through precise boundary determination
- Avoided $200,000 in unnecessary utility upgrades through capacity analysis
- Secured historic preservation approval through impact visualizations
- Reduced design revisions by identifying constraints early
- Provided compelling marketing materials through 3D visualizations
Case Study 3: Regional Utility Coordination
A regional utility authority needed to coordinate water, sewer, and stormwater infrastructure across multiple jurisdictions for a growth corridor.
Challenge: Infrastructure data existed in disparate systems across six municipalities with varying accuracy, formats, and completeness.
GIS Solution:
- Consolidated utility data from all jurisdictions into unified GIS database
- Standardized coordinate systems, attribute schemas, and quality standards
- Integrated infrastructure data with parcel boundaries and zoning information
- Created web-based portal for inter-jurisdictional access and coordination
- Implemented field data collection system for as-built documentation
Results:
- Eliminated duplicate infrastructure investments saving $3.2 million
- Reduced utility conflicts during construction by 75%
- Improved emergency response through accurate infrastructure location data
- Enabled coordinated capacity planning across jurisdictions
- Created foundation for smart city initiatives
Best Practices for Maximizing GIS Integration Value
Data Governance and Quality Control
Establishing robust data governance ensures GIS integration delivers reliable results:
Quality Standards ⭐
- Define accuracy requirements for different data types
- Document acceptable data sources and collection methods
- Establish validation procedures before data publication
- Implement version control for data updates
Metadata Requirements 📋
Comprehensive metadata enables users to assess data fitness:
- Source information and collection methods
- Accuracy and precision specifications
- Date of collection and update schedule
- Coordinate system and projection details
- Known limitations and appropriate uses
Access Control 🔐
Not all GIS data should be publicly accessible:
- Protect sensitive infrastructure data from security threats
- Maintain privacy for confidential property information
- Implement role-based access for different user groups
- Track data usage and modifications for accountability
Effective Communication and Visualization
The power of GIS Integration for Smarter Property Boundary and Zoning Analysis lies partly in its ability to communicate complex information clearly:
Map Design Principles 🎨
- Use intuitive color schemes that convey meaning (green for parks, red for commercial)
- Maintain consistent symbology across related maps
- Include essential map elements (scale, north arrow, legend, title)
- Balance detail with clarity—avoid cluttered maps
Audience-Appropriate Outputs 👥
Different stakeholders need different information:
- Technical professionals: Detailed maps with precise measurements and technical specifications
- Decision-makers: Summary maps highlighting key issues and alternatives
- Public audiences: Simple, visually appealing maps with clear explanations
- Legal proceedings: Formally prepared maps meeting evidentiary standards
Interactive vs. Static Maps 🖱️
Choose the appropriate format:
- Static maps for formal documents, reports, and presentations
- Interactive web maps for exploration, public engagement, and collaboration
- Printed maps for field work and situations without digital access
- 3D visualizations for complex spatial relationships
Continuous Improvement and Innovation
The GIS field evolves rapidly. Maintaining cutting-edge capabilities requires ongoing attention:
Technology Monitoring 🔍
- Follow industry publications and conferences
- Participate in user groups and professional organizations
- Evaluate new tools and techniques for applicability
- Pilot emerging technologies on non-critical projects
Feedback Integration 💬
Learn from users and stakeholders:
- Solicit feedback on map usability and information needs
- Track common questions and confusion points
- Adjust data presentation based on user behavior
- Continuously refine workflows for efficiency
Professional Development 📖
Invest in ongoing skill development:
- Pursue relevant certifications (GISP, ASPRS, RICS)
- Attend training on new software features and techniques
- Cross-train team members for resilience and knowledge sharing
- Stay current with regulatory changes affecting spatial data
When working with professional chartered surveyors, ensuring they utilize modern GIS integration capabilities can significantly enhance the value of their services, whether for residential, commercial, or specialized applications.
Conclusion: Embracing GIS Integration for Competitive Advantage
GIS Integration for Smarter Property Boundary and Zoning Analysis has evolved from a specialized technical capability to an essential tool for anyone involved in property development, land use planning, or real estate decision-making. The ability to overlay multiple datasets—from property boundaries to utility networks to environmental constraints—creates visual intelligence that transforms how professionals approach complex spatial problems.
In 2026, the question is no longer whether to adopt GIS integration, but how to maximize its value for specific applications. The technology has matured to the point where powerful capabilities are accessible to organizations of all sizes, from individual surveying practices to regional planning authorities. Cloud-based platforms, mobile applications, and open data initiatives have democratized access while maintaining professional-grade analytical capabilities.
Key Success Factors
Organizations achieving the greatest value from GIS integration share common characteristics:
✅ Strategic Data Investment: Prioritizing high-quality, current data over extensive but outdated datasets
✅ User-Centered Design: Tailoring GIS implementations to actual workflow needs rather than technical possibilities
✅ Cross-Functional Integration: Breaking down silos between surveying, planning, engineering, and development functions
✅ Continuous Learning: Maintaining technical skills and domain knowledge as both technology and regulations evolve
✅ Stakeholder Engagement: Using GIS visualization to facilitate communication and collaborative decision-making
Actionable Next Steps
For professionals seeking to implement or enhance GIS Integration for Smarter Property Boundary and Zoning Analysis, consider these concrete actions:
1. Assess Current Capabilities 🔎
- Inventory existing data sources and quality
- Evaluate current software tools and workflows
- Identify gaps between current state and desired capabilities
- Benchmark against industry standards and competitors
2. Develop Implementation Roadmap 🗺️
- Define specific use cases and value propositions
- Prioritize quick wins that demonstrate value
- Plan phased implementation matching resources
- Establish success metrics and evaluation methods
3. Build Data Foundation 🏗️
- Identify authoritative data sources for critical layers
- Establish data acquisition agreements and update schedules
- Implement quality control procedures
- Create metadata documentation standards
4. Invest in Skills Development 💪
- Assess team capabilities and training needs
- Provide structured training on selected platforms
- Encourage professional certifications
- Foster knowledge sharing within organization
5. Start Small, Scale Strategically 📈
- Pilot GIS integration on manageable projects
- Document lessons learned and best practices
- Expand capabilities based on demonstrated value
- Share successes to build organizational support
6. Engage Professional Support 🤝
When specialized expertise is needed, working with experienced professionals can accelerate implementation and avoid costly mistakes. Whether seeking property valuation, commercial property surveys, or specialized services, ensure providers leverage modern GIS integration capabilities.
The Competitive Imperative
In an increasingly data-driven real estate and development environment, GIS integration is becoming a competitive necessity rather than a technical luxury. Organizations that effectively harness spatial intelligence make faster, more informed decisions, reduce costly errors, communicate more effectively with stakeholders, and deliver superior value to clients.
The convergence of affordable technology, accessible data, and powerful analytical tools means the barriers to entry have never been lower. At the same time, the complexity of modern development projects—balancing regulatory compliance, environmental sustainability, infrastructure constraints, and economic viability—means the value of comprehensive spatial analysis has never been higher.
GIS Integration for Smarter Property Boundary and Zoning Analysis represents not just a technological advancement, but a fundamental shift in how professionals approach spatial problem-solving. By embracing this transformation and committing to continuous improvement, organizations position themselves for success in an increasingly complex and competitive landscape.
The future belongs to those who can see not just individual properties, but the complex web of spatial relationships, regulatory frameworks, and infrastructure systems that define development possibilities. GIS integration provides the vision to see this complexity clearly and the tools to navigate it successfully. 🚀
References
[1] Land Use Zoning – https://www.mapwise.com/maps/florida/land-use-zoning.php
[2] The Complete Guide To Zoning Laws Florida 2026 Edition – https://jdj-consulting.com/the-complete-guide-to-zoning-laws-florida-2026-edition/
[4] Proposed Florida Legislation Creates 4851851 – https://www.jdsupra.com/legalnews/proposed-florida-legislation-creates-4851851/
[5] brevard-gis-open-data-hub-brevardbocc.hub.arcgis – https://brevard-gis-open-data-hub-brevardbocc.hub.arcgis.com
[6] Maps Gis And Data – https://www.osceola.org/Community/Maps-GIS-and-Data
[8] 2026giseditguide – https://floridarevenue.com/property/Documents/2026giseditguide.pdf
[9] floridadep.gov – https://floridadep.gov/otis/enterprise-application-services/gis