The North West property market presents a fascinating paradox in 2026: while the region outperforms national averages with robust growth, internal disparities create valuation challenges that demand sophisticated survey techniques. Valuing Regional Disparities in 2026: Advanced Techniques for North West Property Surveys has become essential as Greater Manchester properties surge ahead at £241,294 with 4.3% annual growth, while neighboring counties like Lancashire lag at just 84% of regional averages[1]. For chartered surveyors and property professionals, understanding these micro-market variations isn't just beneficial—it's critical to delivering accurate valuations in an increasingly fragmented landscape.
Key Takeaways
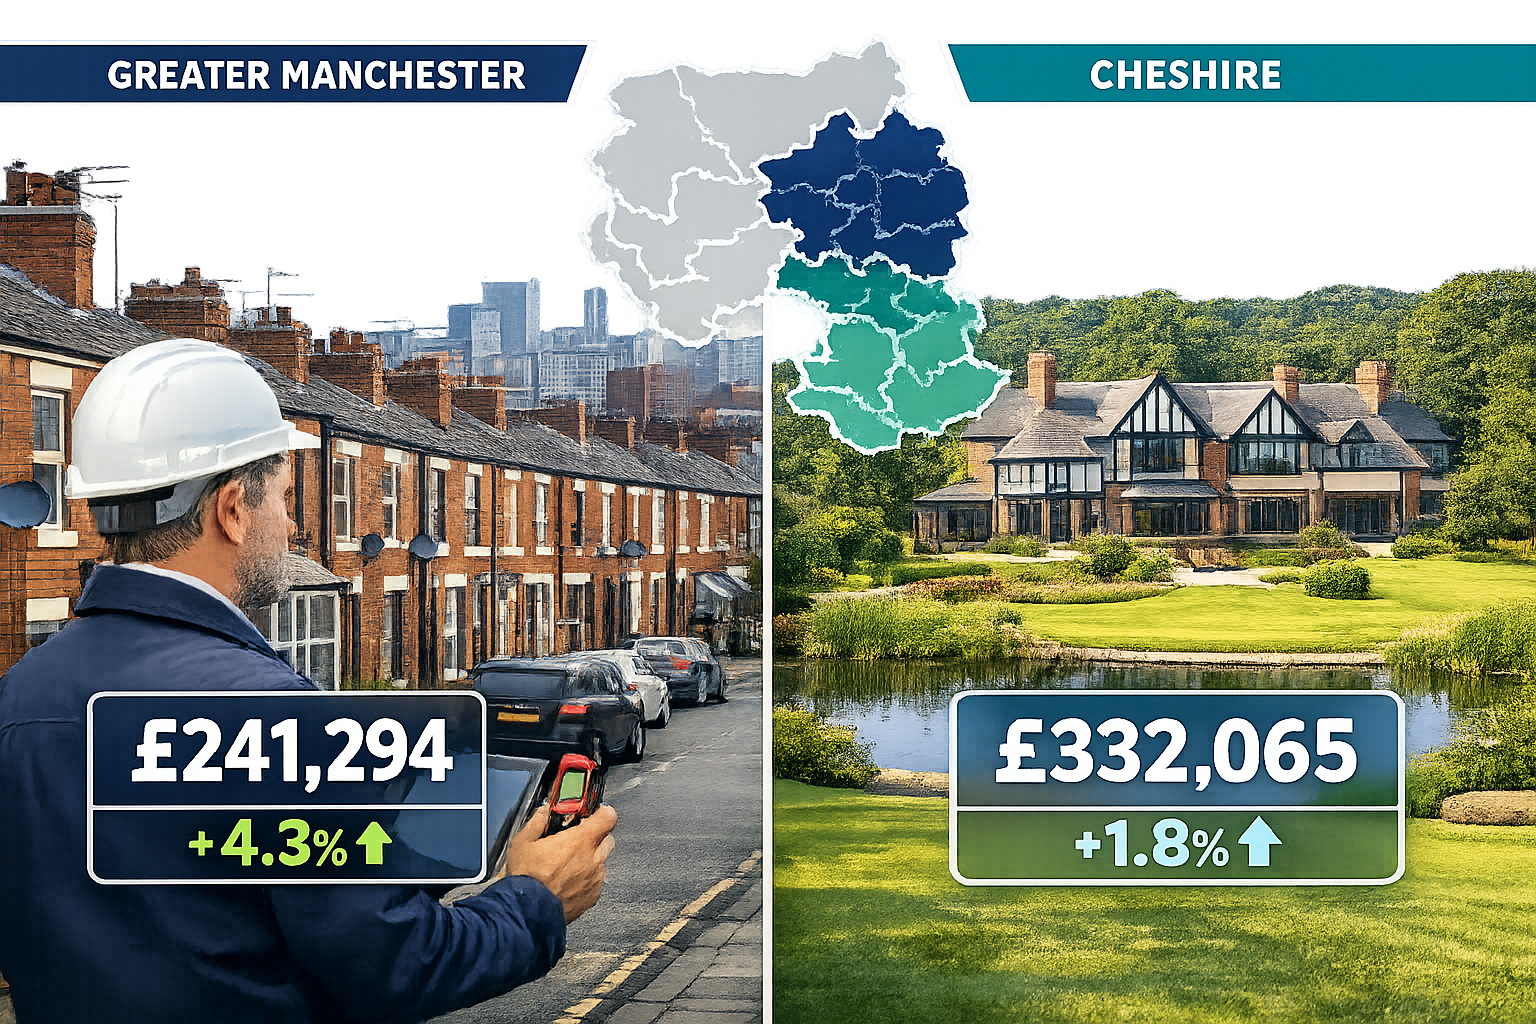
- Greater Manchester significantly outperforms the North West average with properties at £241,294 and +4.3% annual growth, compared to the regional average of £207,511 (+3.4%)[1]
- County-level price variations span 42%, with Cheshire commanding £314k (126% of regional average) while Lancashire sits at £210k (84% of average)[2]
- Advanced survey techniques including comparative market analysis, localized adjustment factors, and technology-enhanced assessments are essential for accurate North West valuations
- Mortgage market expansion to 7,158 products and five-year fixed rates below 4% for the first time since September 2022 significantly impacts affordability assessments[3]
- Transaction volumes declined 15.8% year-on-year across the North West, but supply reached 8-year highs, creating unique valuation dynamics requiring adjusted methodologies[1][3]
Understanding North West Regional Price Disparities in 2026
The North West property market in 2026 demonstrates remarkable internal variation that challenges traditional valuation approaches. While the region ranks 7th nationally with an average price of £250,000 (January 2026)—positioning it below London (£648k), South East (£441k), and East of England (£390k)—the real story lies in the county-by-county disparities[2].
The Greater Manchester Premium Effect 🏙️
Greater Manchester has emerged as the region's growth engine, with properties averaging £241,294 and delivering +4.3% annual appreciation[1]. This performance reflects sustained demand for commuter towns and family housing, driven by:
- Strong employment hubs in Manchester city center and MediaCityUK
- Transport infrastructure improvements including expanded Metrolink networks
- Hybrid working patterns enabling professionals to balance urban access with suburban living
- Investment in regeneration across Salford, Stockport, and Trafford
For surveyors conducting homebuyer surveys in Greater Manchester, these factors necessitate upward adjustments to comparable property valuations, particularly in commuter corridors.
Cheshire's Premium Positioning
Cheshire properties command the region's highest average at £332,065, representing 126% of the North West average[2]. However, annual growth of just +1.8% reveals a mature market where premium pricing limits appreciation potential[1]. This creates distinct valuation considerations:
| Metric | Cheshire | Greater Manchester | Lancashire |
|---|---|---|---|
| Average Price | £332,065 | £241,294 | £210,000 |
| Annual Growth | +1.8% | +4.3% | +2.1% |
| % of Regional Avg | 126% | 116% | 84% |
| Market Character | Mature/Premium | Growth/Dynamic | Value/Emerging |
When conducting RICS building surveys in Cheshire, professionals must account for the wealth effect that sustains prices despite slower growth, while recognizing that comparable properties in neighboring counties may offer misleading benchmarks.
Lancashire and the Value Opportunity
Lancashire properties average £210,000—just 84% of the regional average—yet demonstrate steady growth potential[2]. Towns like Blackburn with Darwen and Oldham have achieved growth exceeding 8% annually, significantly outpacing the North West average of 4.1%[3].
This creates a dual valuation challenge: distinguishing between genuinely undervalued properties with appreciation potential versus those fairly priced for lower amenity levels and economic prospects.
"The North West's 42% price range between premium Cheshire and value Lancashire markets demands surveyors develop county-specific valuation frameworks rather than relying on regional averages."
Advanced Survey Techniques for Valuing Regional Disparities in 2026
Accurately Valuing Regional Disparities in 2026: Advanced Techniques for North West Property Surveys requires surveyors to deploy sophisticated methodologies that account for micro-market variations, economic indicators, and evolving buyer preferences.
Comparative Market Analysis with Localized Adjustments
Traditional comparative market analysis (CMA) struggles when regional disparities span 42% of average values. Advanced practitioners in 2026 employ multi-tiered adjustment frameworks:
Tier 1: County-Level Baseline Adjustments
- Apply county-specific multipliers: Cheshire (1.26x), Greater Manchester (1.16x), Lancashire (0.84x) relative to regional baseline[2]
- Account for historical growth trajectories over 3-5 year periods
- Factor in transaction volume trends (North West saw 90.3k sales in January 2026, down 15.8% year-on-year)[1]
Tier 2: Sub-Regional Economic Indicators
- Employment rates and wage growth in specific boroughs
- Transport connectivity scores (rail links to Manchester, Liverpool)
- School performance ratings and catchment area premiums
- Local regeneration investment and planning permissions
Tier 3: Property-Specific Characteristics
- Condition assessment relative to local stock quality
- Energy efficiency ratings (increasingly valued in 2026)
- Outdoor space premiums (post-pandemic lifestyle changes persist)
- Period features versus modern specifications
For comprehensive property assessments, structural surveys provide the detailed condition analysis necessary to apply these adjustment tiers accurately.
Technology-Enhanced Valuation Approaches
Modern surveyors leverage digital tools to capture and analyze regional disparities more effectively:
🚁 Drone Survey Technology
Drone surveys enable rapid comparative analysis of roof conditions, property boundaries, and neighborhood characteristics across multiple properties, creating visual databases for regional comparison.
📊 Data Analytics and Heat Mapping
Advanced practitioners utilize property price heat maps overlaying the North West's 19.6% concentration of sales in the £150k-£200k range and 17.7% in the £100k-£150k range[2], identifying micro-market boundaries and transition zones.
🔬 Specialized Defect Assessment
Regional building characteristics vary significantly—Victorian terraces dominate Greater Manchester, while Cheshire features more detached period properties. Specific defect reports tailored to regional building typologies improve valuation accuracy.
Mortgage Market Integration
The 2026 mortgage landscape fundamentally impacts valuation approaches. With 7,158 mortgage products available (the highest since October 2007) and five-year fixed rates falling to 3.95%—below 4% for the first time since September 2022—affordability calculations require recalibration[3].
Affordability-Adjusted Valuations now incorporate:
- Buyer purchasing power at current mortgage rates
- Loan-to-value ratios specific to regional risk profiles
- Mortgage approval trends (61,013 in December 2025, down year-on-year but above end-2023 levels)[3]
Understanding structural survey pricing helps buyers budget appropriately when factoring survey costs into overall affordability assessments.
Supply-Demand Dynamics in Valuation Models
The North West began 2026 with the highest level of homes for sale in over eight years, with agents marketing an average of 32 properties[3]. This supply surge creates downward pressure on valuations, particularly in:
- Over-supplied sub-markets where inventory exceeds historical norms
- Properties requiring significant remediation (where damp surveys reveal costly issues)
- Segments affected by mortgage restrictions (higher loan-to-value properties)
Conversely, undersupplied premium segments in Cheshire and central Manchester maintain pricing power despite broader market softening.
Practical Implementation: Valuing Regional Disparities in 2026 Through Advanced North West Property Surveys

Translating theoretical frameworks into practical survey methodologies requires systematic implementation across the valuation process.
Pre-Survey Research Protocol
Before conducting on-site inspections, advanced practitioners complete comprehensive regional positioning analysis:
- Identify the property's micro-market classification (Greater Manchester growth corridor, Cheshire premium, Lancashire value, etc.)
- Extract comparable sales data from the specific price band (19.6% of sales fall in £150k-£200k, 17.7% in £100k-£150k)[2]
- Review local planning applications that may affect future values
- Assess transport infrastructure projects (particularly rail links affecting commuter viability)
- Analyze local employment trends and major employer stability
For properties requiring boundary surveys, understanding local land value variations becomes particularly important.
On-Site Assessment Enhancements
Physical property inspections in 2026 incorporate regional context throughout:
Building Condition Relative to Local Stock
Rather than absolute condition ratings, surveyors assess properties against typical local standards. A "good" condition Victorian terrace in Greater Manchester may differ significantly from a "good" condition detached home in Cheshire.
Regional Building Pathology Recognition
Different North West sub-regions exhibit characteristic building issues:
- Greater Manchester: Victorian terrace damp issues, solid wall insulation challenges
- Cheshire: Period property maintenance backlogs, listed building constraints
- Lancashire: Non-standard construction in 1960s-70s developments
Specialized damp surveys and subsidence surveys address these regional pathologies.
Energy Efficiency Premium Assessment
With 2026 buyers increasingly prioritizing running costs, energy efficiency ratings create valuation differentials that vary by region:
- Premium markets (Cheshire) show 5-8% premiums for EPC A-B ratings
- Value markets (Lancashire) show 2-4% premiums for the same ratings
- Greater Manchester falls between, with 4-6% premiums
Post-Survey Valuation Synthesis
The final valuation report must explicitly articulate regional positioning:
Market Context Statement
"This property is located in [specific sub-region], which currently demonstrates [growth rate] compared to the North West average of +3.4%. The local market is characterized by [supply/demand dynamics], with [transaction volume trends]."
Comparable Property Adjustments
Present a clear table showing:
- Base comparable property values
- County-level adjustments applied
- Sub-regional economic adjustments
- Property-specific condition adjustments
- Final adjusted comparable values
Forward-Looking Commentary
Address growth trajectory based on:
- Regional infrastructure investment
- Employment trends
- Supply pipeline (planning permissions)
- Mortgage market accessibility at current rates
For commercial properties, commercial building surveys require additional analysis of local business conditions and commercial rental trends.
Quality Assurance and Peer Review
Given the complexity of Valuing Regional Disparities in 2026: Advanced Techniques for North West Property Surveys, leading practices implement:
- Cross-regional peer review where valuations are reviewed by surveyors familiar with different North West sub-markets
- Quarterly recalibration of county-level adjustment factors based on latest transaction data
- Client education protocols explaining regional context and valuation methodology
- Post-transaction analysis comparing valuations to actual sale prices to refine models
Emerging Trends Affecting North West Valuations
The Northern Powerhouse Effect
The North West achieved +2.9% growth in February-March 2026, outperforming the national average, while the North East added +3.5%[3]. This positions northern regions as stronger performers for investor valuations, creating:
- Increased institutional investment in Greater Manchester rental properties
- Build-to-rent developments concentrated in urban cores
- Regeneration premiums in formerly industrial areas
Transaction Volume Implications
The 18.9% year-on-year decline in sales agreed across Stockport, Tameside, and Greater Manchester (5,700 sales in February 2026)[1] creates valuation challenges:
- Fewer comparable transactions for recent data
- Increased reliance on asking prices versus achieved prices
- Greater weight on condition and specification differentials
Mortgage Product Proliferation
The expansion to 7,158 mortgage products[3] enables more buyers to access finance, but creates complexity:
- Niche products for specific property types (ex-local authority, non-standard construction)
- Regional lender preferences affecting achievable loan-to-value ratios
- Specialist products for properties requiring remediation work
Understanding when properties might benefit from specific defect reports versus comprehensive Level 3 RICS building surveys helps buyers secure appropriate mortgage products.
Risk Factors in Regional Valuation Disparities
Over-Reliance on Regional Averages
The 42% price variation between Cheshire (£314k) and Lancashire (£210k)[2] means regional averages provide limited guidance. Surveyors must resist the temptation to anchor valuations to North West averages when micro-market conditions diverge significantly.
Growth Rate Extrapolation Errors
Greater Manchester's +4.3% annual growth[1] cannot be assumed to continue indefinitely. Mature markets like Cheshire demonstrate that premium pricing eventually constrains appreciation, requiring surveyors to model growth deceleration scenarios.
Supply Surge Impact Underestimation
With supply at 8-year highs[3], properties that would have sold quickly in 2023-2024 may now face extended marketing periods. Valuations must account for:
- Increased buyer negotiating power
- Greater scrutiny of condition issues
- Price reductions becoming more common
Transaction Volume Decline Complications
The 15.8% reduction in North West transactions[1] means less frequent comparable sales data. Surveyors must widen geographic search parameters while applying appropriate adjustments, increasing uncertainty margins.
Conclusion
Valuing Regional Disparities in 2026: Advanced Techniques for North West Property Surveys represents a fundamental shift from traditional regional averaging approaches to sophisticated, micro-market-focused methodologies. With Greater Manchester properties commanding £241,294 and demonstrating +4.3% growth while Lancashire sits at 84% of regional averages, surveyors must deploy multi-tiered adjustment frameworks, technology-enhanced assessment tools, and comprehensive market analysis to deliver accurate valuations[1][2].
The convergence of record mortgage product availability (7,158 options), eight-year high supply levels, and persistent transaction volume declines creates a complex valuation environment where regional expertise becomes invaluable[3]. Practitioners who master county-specific adjustment factors, integrate affordability modeling, and leverage advanced survey technologies will deliver superior client outcomes in this fragmented market.
Actionable Next Steps
For Property Buyers:
- Commission comprehensive building surveys from surveyors with demonstrated North West regional expertise
- Request explicit explanation of regional adjustment factors applied to your valuation
- Compare growth trajectories between target sub-markets before committing
For Property Professionals:
- Implement quarterly recalibration of county-level valuation multipliers
- Invest in technology platforms enabling heat mapping and comparative analysis
- Develop sub-regional specializations rather than attempting whole-region coverage
For Investors:
- Focus on Greater Manchester growth corridors and outer towns demonstrating 8%+ appreciation
- Avoid over-reliance on Cheshire premium markets showing mature growth profiles
- Model multiple scenarios accounting for supply surge and transaction volume trends
The North West property market in 2026 rewards those who look beyond regional headlines to understand the intricate micro-market dynamics driving value. By applying advanced survey techniques tailored to these regional disparities, property professionals can deliver the precision and insight clients demand in an increasingly complex valuation landscape.
References
[1] North West Property Market Update February 2026 – https://edwardmellor.co.uk/news/north-west-property-market-update-february-2026/
[2] North West House Prices – https://www.plumplot.co.uk/North-West-house-prices.html
[3] Article – https://www.maywhetter.co.uk/news/article.html?id=1772634230