
{"cover":"Professional landscape format (1536x1024) editorial hero image showing a detailed UK map with distinct color-coded regions highlighting Scotland in deep blue, Northern Ireland in emerald green, Northern England in warm amber, and Southern England in muted grey, with upward trending price arrows in the north and flat/downward arrows in the south. A professional surveyor in business attire stands in the foreground holding a tablet displaying property valuation data and regional market analytics. Modern office setting with large windows showing UK cityscapes. Clean, sophisticated color palette of navy blue, forest green, amber gold, and slate grey with high contrast. Magazine-quality editorial photography style with depth of field, sharp focus on the map and surveyor, professional lighting. No text overlays, purely visual composition conveying regional property market divergence and professional surveying expertise across different UK territories.","content":["Detailed landscape format (1536x1024) infographic-style image showing a split-screen comparison of UK regional property markets. Left side displays Northern regions (Scotland, Northern Ireland, North East, North West) with vibrant upward-trending growth charts, percentage indicators showing +7.1%, +4.5%, +6.8%, +4.1% in bold green numbers, house icons with upward arrows, and happy first-time buyer silhouettes. Right side shows Southern regions (London, South East) with flat or declining trend lines, -1.2% and +1.0% in red/amber numbers, stagnant property icons, and longer sale timeline visualizations. Central dividing line represents the north-south divide with a professional surveyor's measuring tools crossing the boundary. Clean data visualization aesthetic with bar charts, line graphs, and regional heat map overlay. Professional color scheme of forest green for growth, amber for moderate performance, and crimson for decline. High-quality editorial infographic style with clear visual hierarchy and data-driven composition.","Landscape format (1536x1024) professional composite image showing three distinct surveyor scenarios across UK regions. First panel: Scottish surveyor conducting property inspection in a modern Edinburgh townhouse with tablet showing comparative market analysis and strong growth indicators, warm natural lighting through Georgian windows. Second panel: Northern Ireland surveyor reviewing traditional Belfast terrace property with digital valuation tools displaying exceptional 7.1% growth metrics, professional measuring equipment visible. Third panel: London surveyor in a premium South East property showing client detailed market reports on large screen with stagnation data and extended marketing period timelines, contemporary office setting. Each panel features professional surveyors in business attire using modern technology, regional architectural styles clearly visible, color-coded borders matching regional performance (blue for Scotland, green for Northern Ireland, grey for London). Editorial photography quality with professional lighting, sharp detail, and authentic surveying scenarios demonstrating region-specific valuation approaches.","Detailed landscape format (1536x1024) conceptual business image showing a professional surveyor's workspace with multiple screens displaying regional UK property data dashboards. Central large monitor shows interactive UK map with color-coded regional performance metrics, heat maps, and price trend overlays. Surrounding screens display detailed analytics: Scottish market momentum charts, Northern Ireland exceptional growth projections, Northern England buyer demand graphs, and Southern market correction forecasts. Desk features professional surveying equipment including laser measures, property documentation, RICS standards manuals, and regional valuation methodology guides. Tablet shows client consultation video call with property owners from different regions. Modern professional office environment with natural light, organized workspace, contemporary furniture. Color palette of professional navy, data visualization blues and greens, amber accent lighting. High-quality editorial business photography with depth, professional composition, authentic surveying tools and technology clearly visible, conveying expertise in regional property valuation strategies."]}

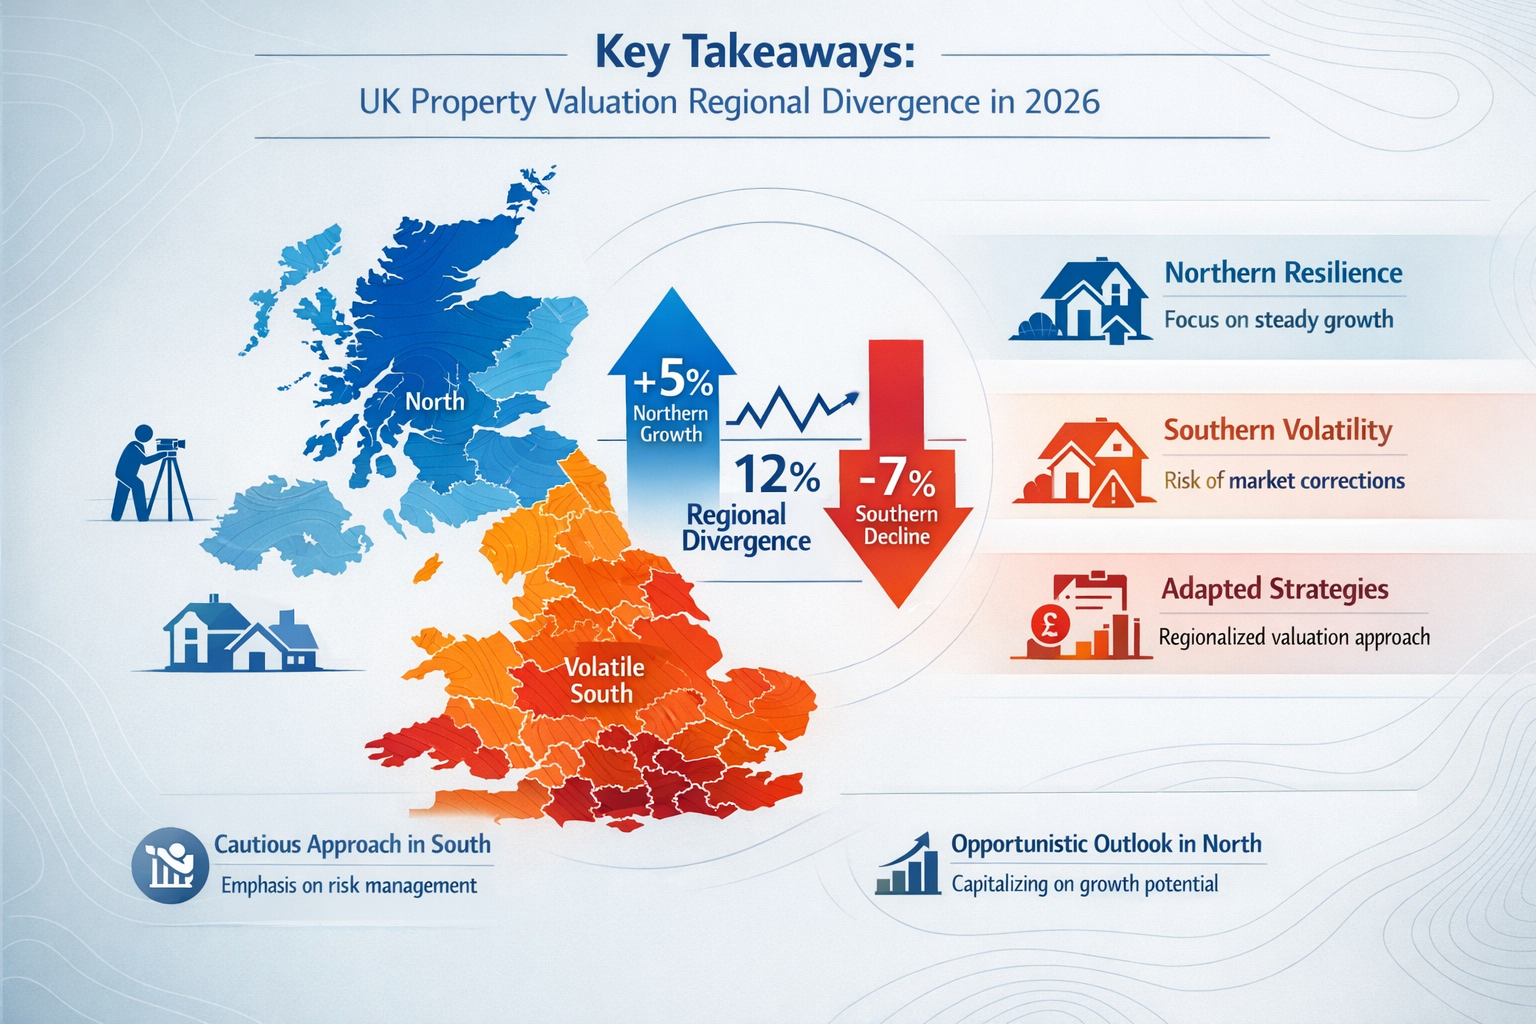
The UK property market in 2026 tells two very different stories. While Scotland and Northern Ireland experience robust price growth exceeding 4.5% annually, London struggles with declining values and extended selling periods. This widening gap presents unprecedented challenges for property surveyors who must navigate Regional Divergence in UK Property Valuations 2026: Surveyor Strategies for Scotland, Northern Ireland, and the North vs. South Divide with precision and regional expertise.
For surveyors, understanding these regional variations isn't just about tracking numbers—it's about developing tailored valuation frameworks that reflect local market dynamics, buyer behaviour, and economic conditions. The traditional one-size-fits-all approach to property valuation no longer serves clients effectively in an increasingly fragmented UK market.
Key Takeaways
- 📊 Northern Ireland leads UK growth at +7.1% annually, while London experiences -1.2% decline, creating the widest regional gap in recent history
- 🏴 Scotland outperforms England significantly with +4.5% growth compared to England's +2.2%, requiring distinct valuation methodologies
- 🧭 North-South divide intensifies with North East England (+6.8%) and North West (+4.1%) far exceeding South East (+1.0%) performance
- 💼 Surveyors must adopt region-specific strategies including different comparable selection, market timing adjustments, and buyer demographic analysis
- 🏠 First-time buyer activity concentrates in affordable northern regions, fundamentally changing demand patterns and valuation considerations
Understanding the 2026 Regional Property Landscape
The UK property market in 2026 operates as a collection of distinct regional markets rather than a unified national system. Overall UK house prices are projected to rise approximately 2-4% in 2026, with most analysts anticipating modest rather than sharp growth driven by easing mortgage rates and steady wage growth[1][3]. However, this national average masks dramatic regional variations that surveyors must understand.
The Numbers Behind the Divide
Regional annual inflation data from 2025 year-to-date reveals the scale of divergence:
| Region | Annual Growth Rate | Market Status |
|---|---|---|
| 🇮🇪 Northern Ireland | +7.1% | Exceptional growth |
| 🏴 Scotland | +4.5% | Strong momentum |
| 📍 North East England | +6.8% | Leading English region |
| 📍 North West England | +4.1% | Above-average growth |
| 📍 Yorkshire & Humber | +3.7% | Solid performance |
| 🏴 England (overall) | +2.2% | Moderate growth |
| 📍 South East England | +1.0% | Weak growth |
| 🏙️ London | -1.2% | Market decline |
| 🏴 Wales | +0.7% | Minimal growth |
These figures demonstrate that the north-south divide in England is expected to persist throughout 2026, with stronger growth concentrated in northern regions and weaker performance in southern areas[3]. Professional commercial property surveyors must account for these variations when conducting valuations across different territories.
Why Regional Divergence Matters for Surveyors
London remains the only major region where prices have fallen or stagnated, with properties taking longer to sell than in the rest of the UK[1]. This creates specific challenges for surveyors conducting property valuations in the capital versus those working in Scotland or Northern Ireland.
The disconnect extends beyond residential markets. Despite residential price weakness, London's commercial property rateable values increased by 22.3% in the 2026 non-domestic rating revaluation—the largest increase of any English region[2]. This commercial-residential divergence requires surveyors to maintain separate analytical frameworks for different property types.
Regional Divergence in UK Property Valuations 2026: Scotland and Northern Ireland Strategies
Scotland's +4.5% annual growth significantly outpaces England's +2.2%, indicating strong market momentum that requires specific surveyor approaches[3]. Northern Ireland's exceptional performance at +7.1% annual growth suggests particularly strong valuation pressures and surveyor demand in this market[3].
Scotland-Specific Valuation Approaches
Scottish surveyors face a unique regulatory and market environment. The Scottish property system operates differently from England and Wales, with distinct legal frameworks, faster transaction processes, and different buyer expectations.
Key considerations for Scottish valuations:
- Offers over pricing strategy: Scottish properties typically list with "offers over" prices, requiring surveyors to estimate realistic final sale prices above the asking figure
- Closing date dynamics: Multiple interested parties often trigger closing dates, creating competitive bidding that can push prices 5-15% above asking prices in strong markets
- Urban concentration: Growth concentrates in Edinburgh, Glasgow, and Aberdeen, with significant variation between city centres and rural areas
- First-time buyer accessibility: Scotland's more affordable entry points compared to southern England attract significant first-time buyer activity, changing demand dynamics
When conducting valuations in Scotland, surveyors should adjust comparable evidence to reflect the competitive bidding environment and account for the faster transaction timeline that can create upward price pressure.
Northern Ireland's Exceptional Market
Northern Ireland leads all UK regions with +7.1% annual growth[3], creating unique challenges for surveyors operating in this market. This exceptional performance stems from several factors:
- Affordability advantage: Northern Ireland maintains the UK's most affordable property prices relative to local incomes
- Pent-up demand: Years of market underperformance have created strong demand as economic conditions improve
- Limited supply: Construction activity hasn't kept pace with population growth and household formation
- Cross-border dynamics: Brexit has created new economic patterns affecting property demand
Surveyors in Northern Ireland must recognize that standard comparable evidence may understate current market momentum. Properties are selling faster and achieving higher prices than recent historical data suggests. Adjusting valuation timelines and giving greater weight to very recent transactions becomes essential.
For those conducting probate valuations or divorce valuations in Northern Ireland, the rapid price appreciation requires careful consideration of valuation dates and potential market movement during legal proceedings.
Comparable Selection in High-Growth Regions
In both Scotland and Northern Ireland, traditional comparable selection methods require modification:
- Time weighting: Give significantly more weight to transactions from the last 3 months versus 6-12 months ago
- Market momentum adjustments: Apply upward adjustments to older comparables to reflect continuing price appreciation
- Location micro-analysis: Recognize that growth concentrates in specific neighbourhoods and property types
- Buyer demographic shifts: Account for changing buyer profiles, particularly increased first-time buyer activity
One of the defining features of the 2026 market is increased activity from first-time buyers, enabled by easier mortgage conditions and lower relative borrowing costs, particularly in more affordable cities and towns[6]. This demographic shift fundamentally changes valuation considerations in Scotland and Northern Ireland.
Regional Divergence in UK Property Valuations 2026: Northern England vs. Southern England Tactics
The North East shows the highest annual growth in England at +6.8%, followed by the North West at +4.1% and Yorkshire & Humber at +3.7%[3]. Meanwhile, London experienced -1.2% annual decline and the South East achieved only +1.0% growth[3]. This dramatic divide requires fundamentally different surveyor tactics.
Northern England: Growth Market Strategies
Northern England and Wales are likely to see more market movement in 2026, giving sellers confidence that buyer demand is returning[1]. Surveyors working in these markets should adopt growth-oriented strategies:
Valuation adjustments for northern markets:
- Optimistic comparable weighting: Recent sales provide better guidance than older transactions in rising markets
- Development potential recognition: Areas experiencing regeneration and infrastructure investment warrant premium valuations
- Rental yield emphasis: Northern properties often offer superior rental yields, important for buy-to-let valuations
- Affordability analysis: First-time buyer purchasing power significantly influences market dynamics
Even with modest price growth, demand for homes to purchase remains solid in many regions outside London, with notable price surges in towns like Plymouth, Stafford, and Wigan in 2025[6]. Surveyors must identify these local hotspots and adjust valuations accordingly.
When conducting freehold valuations or help to buy valuations in northern regions, recognize that government schemes and first-time buyer incentives have disproportionate impact compared to southern markets where affordability remains challenging.
Southern England: Stagnation and Correction Tactics
London and the South East present entirely different challenges. The capital's -1.2% decline and extended selling periods require conservative, evidence-based approaches[3].
Southern market valuation considerations:
- Extended marketing period adjustments: Properties take longer to sell, affecting valuation certainty and client expectations
- Downward price negotiation patterns: Buyers increasingly negotiate below asking prices, requiring realistic valuations
- Stock market sensitivity: Southern markets correlate more closely with financial market performance and economic uncertainty
- Premium property concentration: High-value properties face particular challenges, with luxury segments underperforming
Surveyors conducting valuations in West London, Central London, or East London must carefully manage client expectations. The data shows clear market weakness that optimistic valuations cannot ignore.
Practical Application: North vs. South Comparable Analysis
Consider a surveyor valuing similar three-bedroom semi-detached properties in Newcastle (North East) and Reading (South East):
Newcastle approach:
- Select comparables from last 2-3 months maximum
- Apply upward adjustment for market momentum (+2-3%)
- Consider first-time buyer demand premium
- Recognize limited stock creating competitive pressure
- Result: Valuation at upper end of comparable range
Reading approach:
- Use broader 6-month comparable timeframe
- Apply conservative adjustments or slight downward correction
- Account for extended marketing periods (60-90 days vs. 30-45 days)
- Recognize buyer negotiating power in stagnant market
- Result: Valuation at middle or lower end of comparable range
This contrasting approach reflects the reality of Regional Divergence in UK Property Valuations 2026: Surveyor Strategies for Scotland, Northern Ireland, and the North vs. South Divide.
Advanced Surveyor Strategies for Regional Divergence

Professional surveyors must develop sophisticated approaches to navigate the 2026 regional landscape effectively. Beyond basic comparable selection, several advanced strategies prove essential.
Multi-Method Valuation Verification
In divergent markets, relying on a single valuation method creates unnecessary risk. Surveyors should employ multiple approaches:
- Comparative method: Traditional comparable sales analysis adjusted for regional market conditions
- Income approach: Particularly relevant in northern regions with strong rental yields
- Residual method: For development opportunities in regenerating northern areas
- Investment method: For commercial properties reflecting regional economic performance
Cross-referencing multiple methods provides validation and helps identify when regional market dynamics create unusual valuation scenarios.
Regional Economic Indicator Integration
Property values don't exist in isolation. Surveyors should integrate regional economic data:
- Employment trends: Job growth in Manchester, Leeds, and Edinburgh supports price appreciation
- Wage growth patterns: Regional wage increases affect affordability and buyer capacity
- Infrastructure investment: HS2, Northern Powerhouse, and Scottish transport projects influence long-term values
- Population migration: Internal UK migration from south to north affects demand patterns
Understanding these broader economic factors helps surveyors provide context for current valuations and anticipate future trends.
Technology-Enabled Regional Analysis
Modern surveying increasingly relies on technology to manage regional complexity:
- Automated valuation models (AVMs): Use with caution, ensuring regional calibration
- Geographic information systems (GIS): Map price variations at granular neighbourhood levels
- Transaction databases: Access comprehensive regional sales data for robust comparable selection
- Market analytics platforms: Track regional trends, days on market, and price achievement rates
However, technology cannot replace professional judgment. Surveyors must interpret data through the lens of local market knowledge and regional expertise.
Client Communication Strategies
Regional divergence creates client communication challenges. Sellers in London may struggle to accept that their property hasn't appreciated like their cousin's home in Glasgow. Buyers relocating from northern regions may experience sticker shock at southern prices.
Effective communication approaches:
- Provide regional context: Explain market position relative to regional and national trends
- Use visual comparisons: Charts and graphs illustrating regional performance differences
- Set realistic expectations: Particularly important in stagnant southern markets
- Highlight opportunities: Northern buyers can access better value; southern sellers may find opportunities elsewhere
Clear, evidence-based communication builds trust and helps clients make informed decisions despite regional complexity.
Specialist Valuation Considerations
Certain valuation types require particular attention in regionally divergent markets:
Capital gains tax valuations: Regional divergence affects historical valuations and gain calculations, particularly for properties held long-term across different regional cycles.
Shared ownership valuations: Regional affordability differences significantly impact shared ownership demand and staircasing potential.
Right to buy appraisals: Discount percentages have different practical impacts in high-growth northern markets versus stagnant southern markets.
Reinstatement cost valuations: Building costs vary regionally but not as dramatically as market values, creating different value-to-rebuild ratios across regions.
Future-Proofing Regional Valuation Strategies
The 2026 regional divergence won't necessarily persist indefinitely. Surveyors must develop flexible strategies that adapt to changing market conditions.
Monitoring Leading Indicators
Several indicators suggest potential shifts in regional dynamics:
- Mortgage approval rates: Regional variations in lending activity predict future price movements
- Housing starts: New construction concentrating in specific regions affects future supply
- Rental market trends: Rental growth often precedes sales price appreciation
- Commercial property performance: Business investment patterns influence residential demand
By monitoring these leading indicators, surveyors can anticipate regional trend changes before they fully materialize in sales data.
Scenario Planning for Clients
Professional surveyors should help clients understand potential future scenarios:
Optimistic scenario: Northern growth continues, southern markets stabilize and begin recovery, regional gap narrows by 2027-2028.
Pessimistic scenario: Economic headwinds slow northern growth while southern markets continue struggling, maintaining wide regional gaps.
Most likely scenario: Gradual convergence as southern affordability improves slightly while northern growth moderates, but persistent north-south differences continue.
Scenario planning helps clients make strategic decisions about property purchases, sales, and investments across different UK regions.
Professional Development and Regional Expertise
Surveyors cannot be equally expert in all regional markets. Consider:
- Developing regional specializations: Focus expertise on specific geographic areas
- Building regional networks: Connect with local surveyors, agents, and market professionals
- Continuous market monitoring: Regularly review regional data and transaction patterns
- Cross-regional collaboration: Partner with surveyors in other regions for client referrals and knowledge sharing
The RICS and professional surveying bodies increasingly recognize the importance of regional expertise in maintaining valuation quality and professional standards.
Conclusion
Regional Divergence in UK Property Valuations 2026: Surveyor Strategies for Scotland, Northern Ireland, and the North vs. South Divide represents one of the most significant challenges facing property professionals today. With Northern Ireland leading at +7.1% growth, Scotland performing strongly at +4.5%, and London declining at -1.2%, surveyors can no longer apply uniform valuation approaches across the UK.
The strategies outlined in this article provide a framework for navigating regional complexity:
✅ Adapt comparable selection to reflect regional market momentum and timing
✅ Employ region-specific adjustments recognizing different buyer demographics and market dynamics
✅ Integrate economic indicators to understand broader forces driving regional divergence
✅ Communicate effectively with clients about regional context and realistic expectations
✅ Monitor leading indicators to anticipate future regional trend shifts
For surveyors, the path forward requires commitment to regional expertise, flexible methodologies, and continuous market monitoring. Those who develop sophisticated regional strategies will better serve clients and maintain professional standards in an increasingly fragmented UK property market.
Next Steps for Property Surveyors
- Audit your current approach: Review recent valuations to identify where regional factors may have been underweighted
- Enhance data sources: Invest in regional market analytics and transaction databases
- Develop regional networks: Build relationships with professionals in key markets outside your primary area
- Update client communication: Incorporate regional context into all valuation reports and client discussions
- Pursue continuing education: Attend regional market briefings and professional development focused on geographic specialization
The UK property market of 2026 demands more from surveyors than ever before. By embracing regional complexity and developing tailored strategies for Scotland, Northern Ireland, and the widening north-south divide, property professionals can deliver the accurate, contextual valuations their clients deserve.
References

[1] Uk House Prices In 2026 Where The Market Is Headed What It Means For Buyers Sellers And Landlor – https://www.approvedbusinessfinance.co.uk/post/uk-house-prices-in-2026-where-the-market-is-headed-what-it-means-for-buyers-sellers-and-landlor
[2] Non Domestic Rating Reval 2026 Draft List Statistical Commentary – https://www.gov.uk/government/statistics/non-domestic-rating-change-in-rateable-value-of-rating-lists-england-and-wales-2026-revaluation-draft-list/non-domestic-rating-reval-2026-draft-list-statistical-commentary
[3] House Price Forecast – https://hoa.org.uk/advice/guides-for-homeowners/i-am-buying/house-price-forecast/
[4] Valuation Strategies For The 2026 Uk Housing Recovery Regional Price Divergence And Surveyor Tactics – https://nottinghillsurveyors.com/blog/valuation-strategies-for-the-2026-uk-housing-recovery-regional-price-divergence-and-surveyor-tactics
[5] Watch – https://www.youtube.com/watch?v=3xoTNhz_qGY
[6] Should You Sell Or Rent Your Home In 2026 – https://www.lovelle.co.uk/guides/selling/should-you-sell-or-rent-your-home-in-2026/