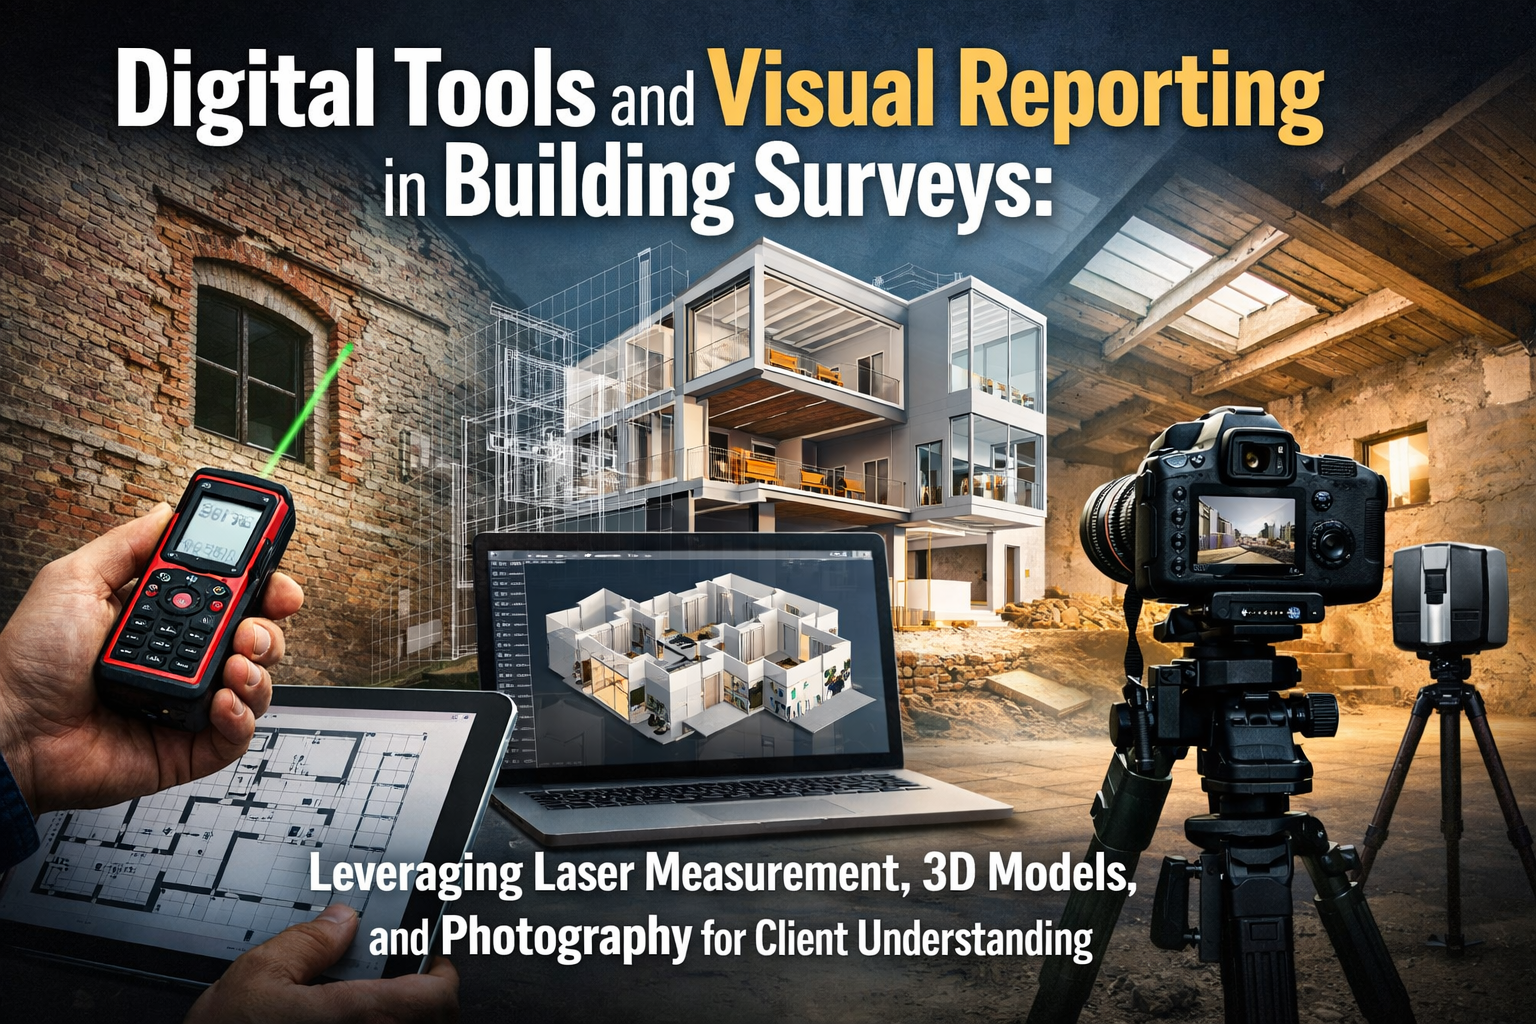
Imagine receiving a building survey report filled with technical jargon, vague descriptions of "moderate dampness," and hand-drawn sketches that leave you wondering exactly where the problem is—and how serious it really is. For decades, property buyers have struggled to translate written survey reports into actionable decisions. But in 2026, Digital Tools and Visual Reporting in Building Surveys: Leveraging Laser Measurement, 3D Models, and Photography for Client Understanding is transforming how chartered surveyors communicate property defects, empowering clients to negotiate confidently and make informed purchasing decisions.
The shift from text-heavy reports to visual, interactive deliverables represents more than just technological advancement—it fundamentally changes the relationship between surveyors and clients. Instead of interpreting written descriptions, buyers can now see precisely where structural cracks appear, understand the exact extent of damp penetration through thermal imaging, and explore interactive 3D models that contextualize defects within the entire property structure.
Key Takeaways
- 📊 Laser measurement technology delivers millimeter-level accuracy, eliminating ambiguity in defect documentation and providing precise data for repair cost estimates
- 🚁 Drone surveys complete roof and tall structure inspections 10 to 50 times faster than traditional methods while eliminating safety risks[1]
- 🎯 3D digital models allow clients to visualize defects in spatial context, transforming abstract written descriptions into clear, actionable information
- 📸 High-resolution photography with annotation overlays creates visual evidence that clients can reference during negotiations and contractor consultations
- 💡 Interactive digital reports replace static PDFs with browser-based platforms where clients can zoom, rotate, and explore property conditions at their own pace
- 🤝 Visual reporting improves client confidence, reducing post-survey confusion and enabling more informed decision-making during property transactions
The Evolution from Written Descriptions to Visual Documentation
Traditional Building Survey Limitations
For generations, RICS building surveys relied primarily on written descriptions to convey property conditions. A surveyor might describe a roof as having "several missing tiles in the southwest elevation" or note "moderate dampness evident in the rear ground floor wall." While technically accurate, these descriptions left significant room for interpretation.
Common challenges with traditional text-based reports include:
- ❌ Ambiguity in severity assessments (what exactly constitutes "moderate" versus "severe"?)
- ❌ Difficulty visualizing spatial relationships between defects
- ❌ Limited ability to verify observations after the survey date
- ❌ Challenges communicating findings to contractors for quotations
- ❌ Reduced client confidence when making significant financial decisions
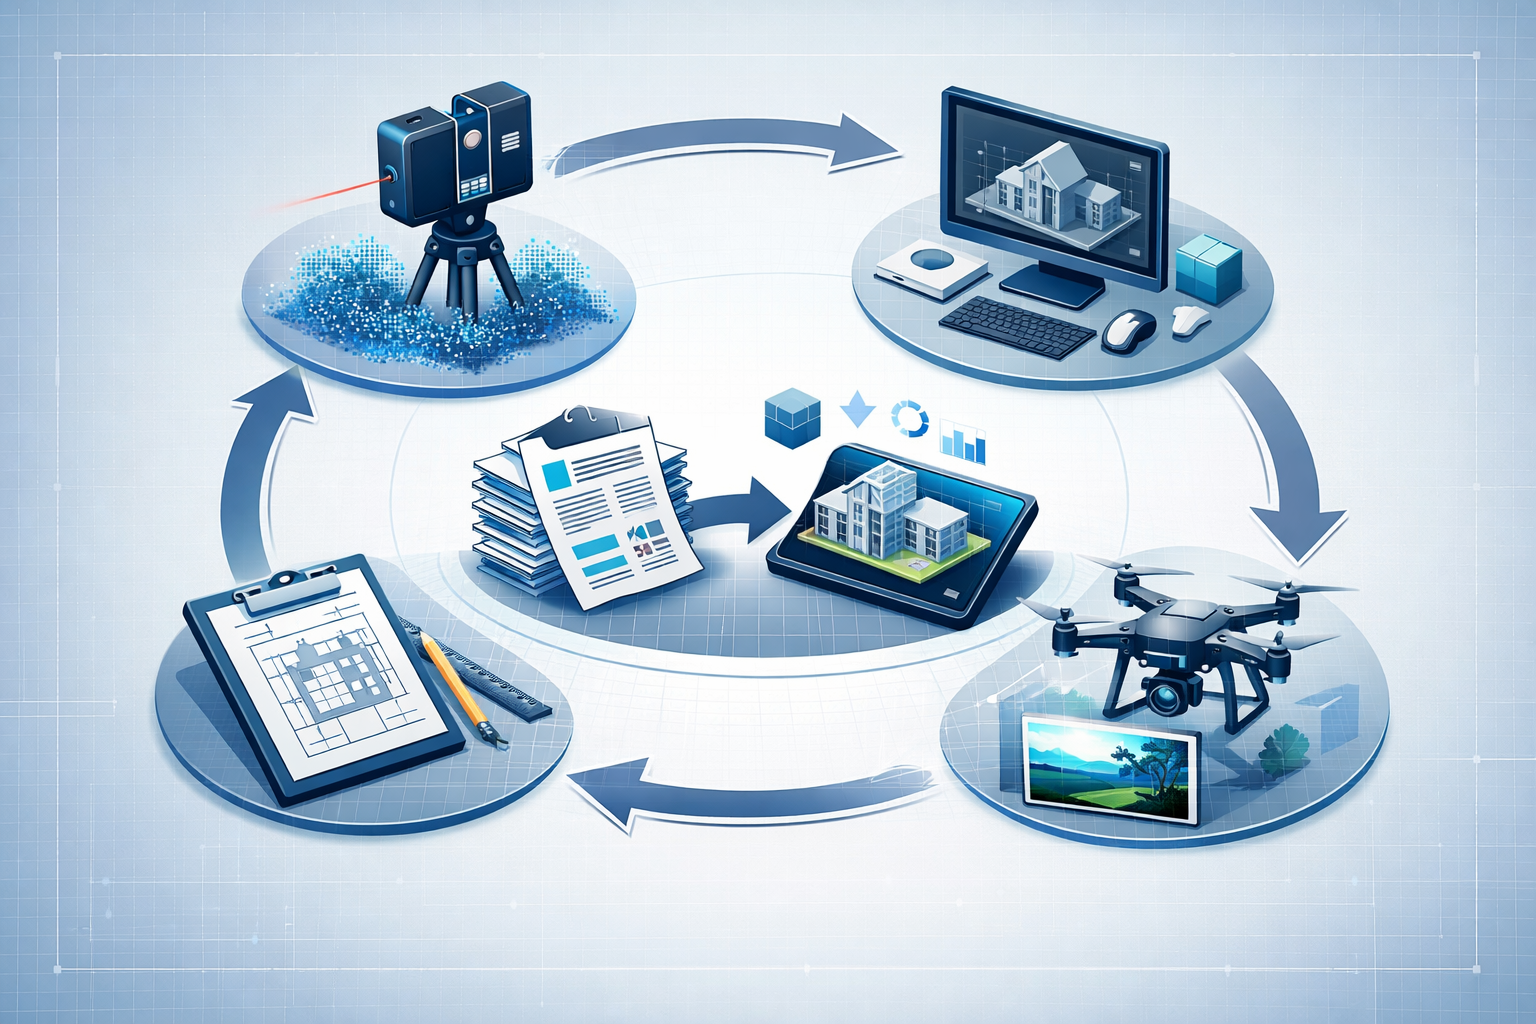
The Digital Transformation in Building Surveys
The construction and surveying industries are experiencing a fundamental shift toward visual, data-driven workflows. Reality capture technology—once limited to specialized firms with substantial capital investment—is now democratizing across the industry through user-friendly tools and broader platform support.[3][4] This accessibility allows surveying firms of all sizes to enhance precision, improve safety outcomes, and accelerate project timelines.[3]
"Design, construction, and operations discussions increasingly occur directly within 3D models rather than on traditional 2D plans, enabling quicker iterations and stronger alignment throughout the project lifecycle."[3]
This transformation extends beyond commercial construction into residential building surveys. Chartered surveyors conducting Level 2 homebuyer surveys and comprehensive Level 3 building surveys are increasingly incorporating digital tools that translate technical findings into visual formats that clients can immediately understand.
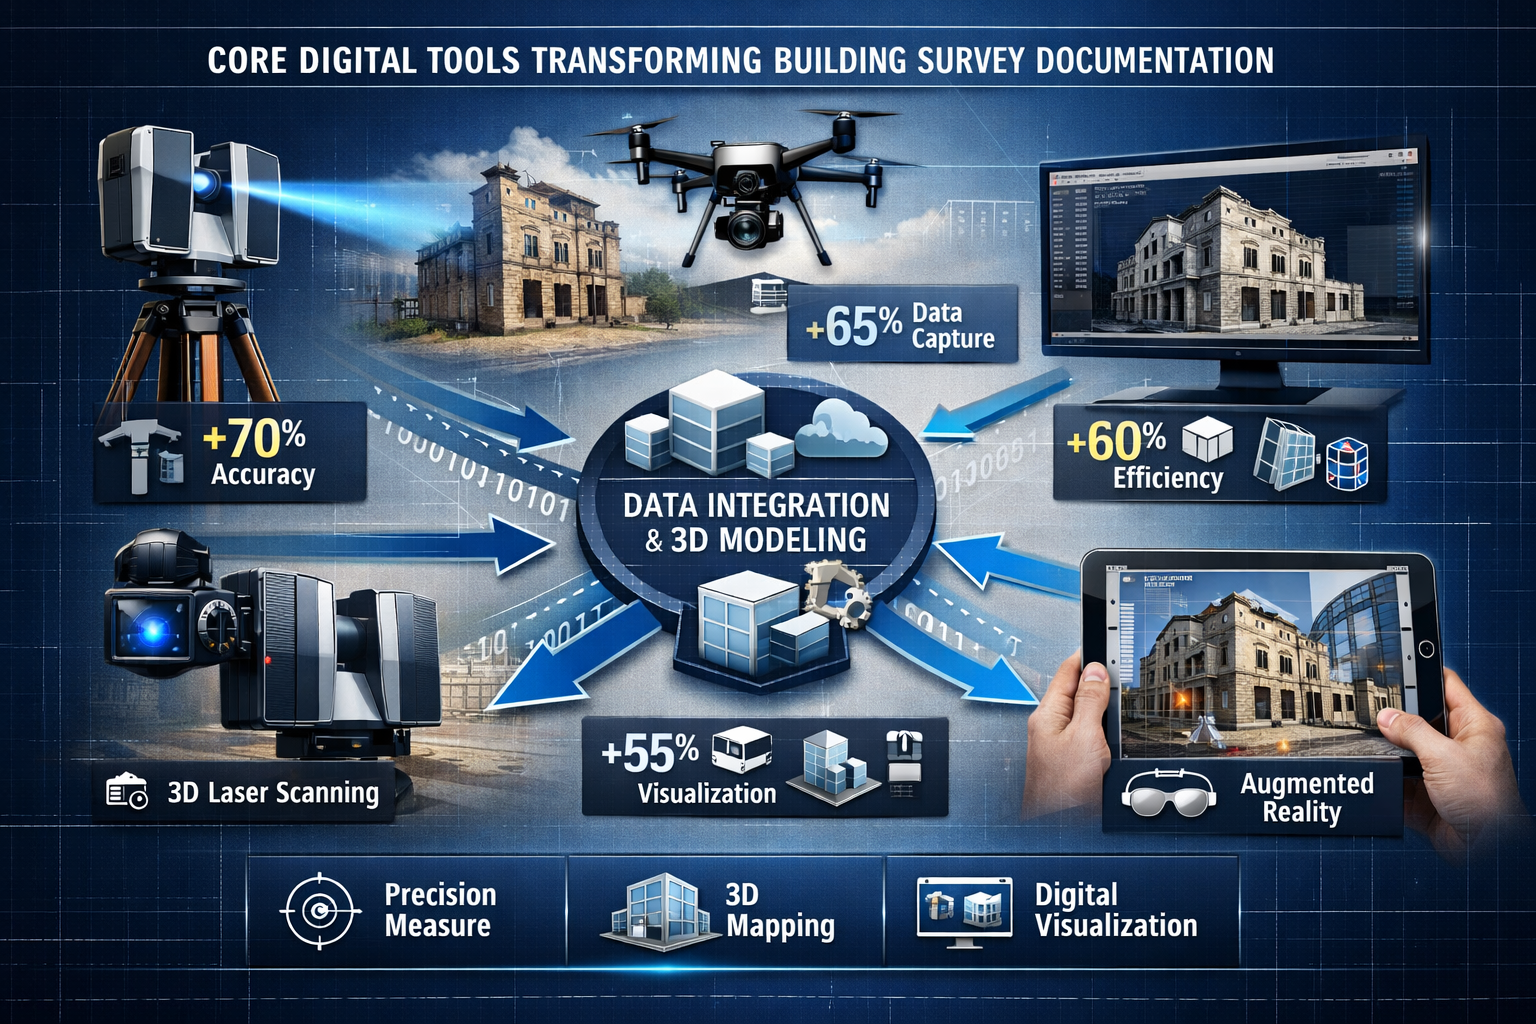
Core Digital Tools Transforming Building Survey Documentation
Laser Measurement Technology: Precision That Eliminates Ambiguity
Laser distance meters and laser scanning technology have revolutionized how surveyors capture dimensional data. Unlike traditional tape measures that introduce human error and estimation, laser tools provide millimeter-level accuracy that removes ambiguity from defect documentation.
Key applications in building surveys include:
| Application | Traditional Method | Laser Technology Advantage |
|---|---|---|
| Ceiling height measurement | Tape measure + estimation | Instant, precise measurements to 1mm accuracy |
| Structural movement tracking | Visual assessment + ruler | Documented baseline for future monitoring surveys |
| Room dimension verification | Manual tape measurement | Complete room scanning in seconds |
| Crack width assessment | Comparative estimation | Precise measurements for severity classification |
| Settlement quantification | Spirit level + estimation | Accurate floor level mapping across entire property |
For subsidence surveys, laser measurement creates precise baseline documentation that enables accurate monitoring of structural movement over time. This data proves invaluable when determining whether cracks are historic and stable or represent ongoing settlement requiring intervention.
3D Modeling and Point Cloud Technology
3D laser scanning creates comprehensive point clouds—millions of precisely measured points that collectively form a complete three-dimensional representation of a property. This technology transforms how surveyors document and communicate complex structural conditions.
Benefits for client understanding:
- 🏠 Spatial context: Clients can see exactly where defects appear within the overall building structure
- 📏 Accurate measurements: Any dimension can be extracted from the model after the survey
- 🔄 Multiple perspectives: View defects from any angle, not just the surveyor's original vantage point
- 📱 Remote accessibility: Clients can explore the model from home, sharing with family or advisors
- 💾 Permanent record: Complete documentation of property condition at survey date
According to industry research, real-time 3D digital twins are emerging as a deliverable, representing "a significant shift from static survey documents to dynamic, interactive deliverables."[2] While full digital twin implementation remains more common in commercial projects, the underlying technology is increasingly accessible for residential surveys.
High-Resolution Photography and Thermal Imaging
Professional photography has always been part of building surveys, but modern digital cameras combined with annotation software transform static images into powerful communication tools.
Advanced photographic documentation includes:
- High-resolution defect photography with measurement scales for size reference
- Annotated images with arrows, labels, and severity indicators overlaid directly on photographs
- Before-and-after comparison images showing progression of defects over time
- Thermal imaging revealing hidden moisture, insulation gaps, and heat loss
- Ultraviolet photography detecting previously painted-over repairs or hidden staining
Thermal imaging proves particularly valuable for identifying moisture ingress that isn't yet visible to the naked eye. A wall might appear dry in standard photography but show clear cold spots in thermal imaging, indicating hidden dampness that will eventually manifest as visible staining or mold growth.
For specialist defect surveys focusing on specific concerns like dampness or structural movement, thermal imaging provides objective visual evidence that supports the surveyor's written assessment.
Drone Technology for Roof and Height Surveys
Drone surveys have revolutionized how surveyors inspect roofs, chimneys, and tall structures. EarthStar Geomatics reports that drones with photogrammetry and LiDAR scanning produce topographic surveys and volume measurements 10 to 50 times faster than traditional methods, while also enabling roof and tall structure inspections without safety risks.[1]
Advantages of drone-based roof surveys:
- ✅ Safety: Eliminates need for ladder access or scaffolding on dangerous roofs
- ✅ Comprehensive coverage: Captures entire roof surface, not just accessible sections
- ✅ High-resolution imagery: 4K video and photography reveal tile condition, flashing details, and chimney status
- ✅ Client accessibility: Buyers can see their future roof in detail before purchase
- ✅ Cost efficiency: Reduces survey time and eliminates expensive access equipment
Traditional roof surveys often relied on binocular inspection from ground level, which limited visibility and detail. Drone technology provides comprehensive visual documentation that clients can review alongside the written report, understanding exactly which sections require repair or replacement.
How Digital Tools and Visual Reporting Enhance Client Understanding
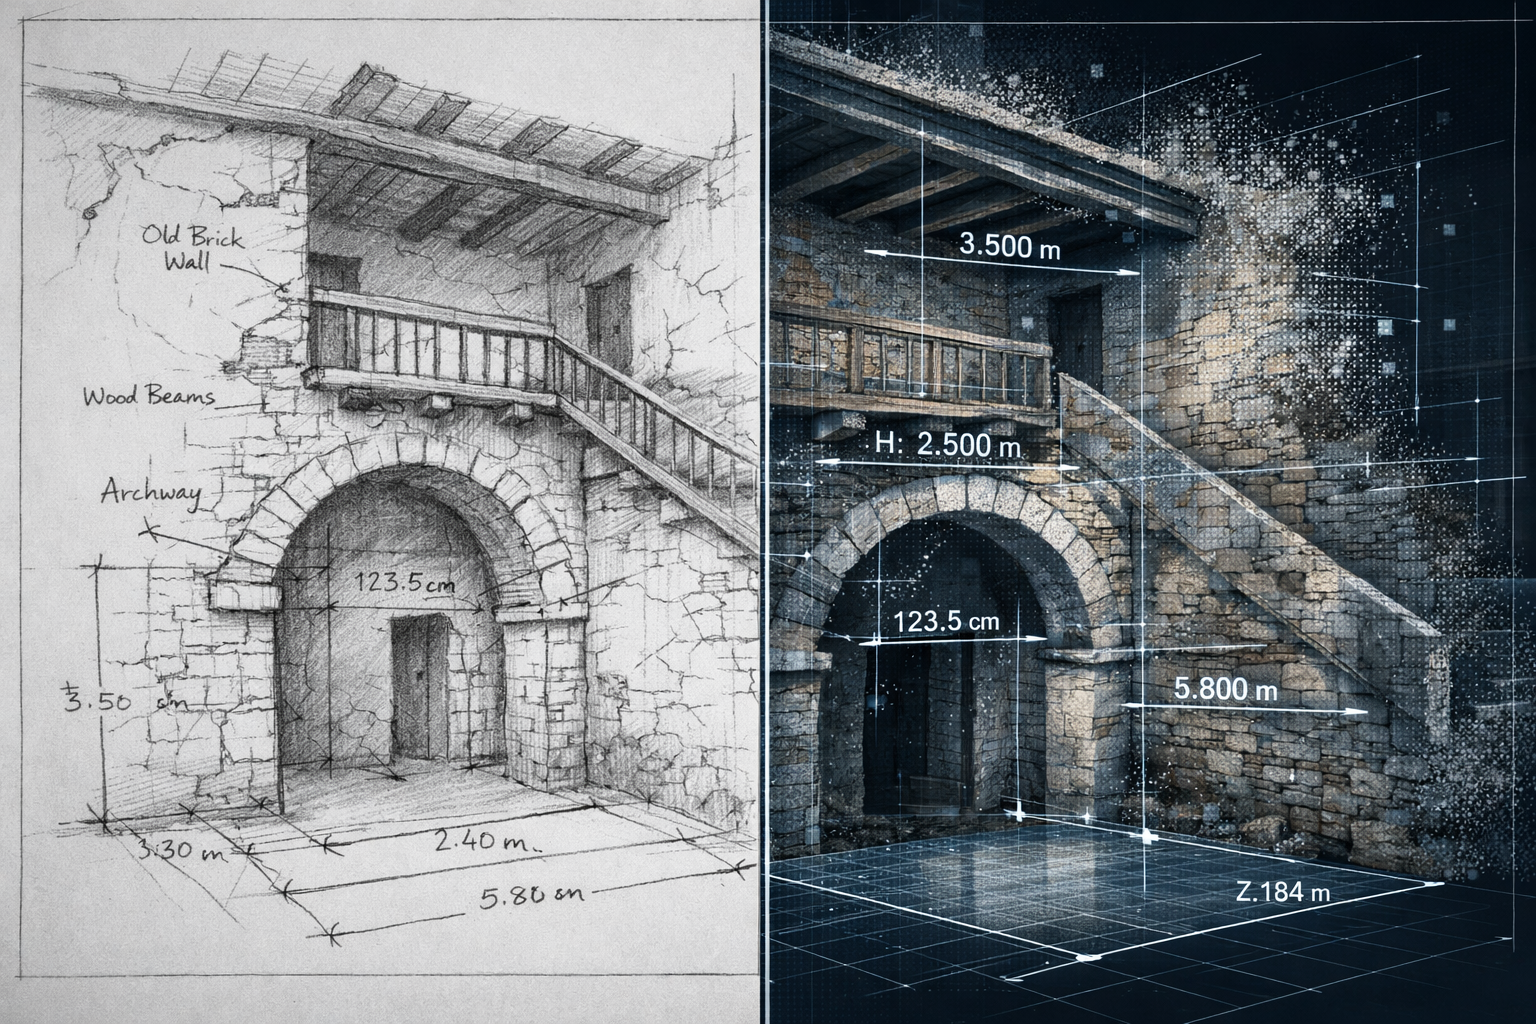
From Abstract Descriptions to Concrete Visualization
The fundamental value of Digital Tools and Visual Reporting in Building Surveys: Leveraging Laser Measurement, 3D Models, and Photography for Client Understanding lies in transforming abstract technical language into concrete visual information that anyone can comprehend.
Consider these comparison examples:
Traditional written description:
"Moderate structural cracking observed in the rear elevation first-floor bedroom, extending diagonally from window head to ceiling junction, approximately 3mm width, likely resulting from historic settlement."
Enhanced visual reporting:
High-resolution photograph showing the exact crack location, with digital overlay indicating precise 3.2mm width measurement from laser tool, color-coded severity indicator (amber for "monitor but not urgent"), annotation arrows pointing to crack origin and terminus, thermal image showing no associated moisture, and reference to 3D model showing crack position within overall building structure.
The visual approach eliminates ambiguity while providing multiple layers of information that clients can process at their own pace.
Interactive Digital Reports: The New Standard
Cloud-based platforms are replacing static document delivery as modern clients expect instant file sharing, browser-based 3D visualization, real-time revision syncing, and integrated communication capabilities rather than static PDF or CAD deliverables.[2]
Features of modern interactive survey reports:
- 📱 Mobile-responsive design: Review reports on smartphones, tablets, or computers
- 🔍 Zoomable imagery: Examine defect details at high magnification
- 🏷️ Clickable defect markers: Select any issue to view detailed information, photographs, and recommendations
- 💬 Integrated commenting: Ask questions directly within the report for surveyor response
- 📊 Severity filtering: View only urgent issues, or see complete comprehensive findings
- 🔗 Shareable links: Provide access to solicitors, mortgage brokers, or family members
- 📥 Downloadable sections: Export specific defects or areas for contractor quotations
This interactivity fundamentally changes how clients engage with survey findings. Rather than reading a 50-page document linearly, clients can explore areas of concern, understand spatial relationships, and focus on issues most relevant to their decision-making process.
Improved Negotiation Outcomes Through Visual Evidence
When buyers discover significant defects during a survey, they typically attempt to renegotiate the purchase price or request that sellers complete repairs before completion. Visual documentation dramatically strengthens negotiating positions.
How visual reporting supports negotiations:
- Undeniable evidence: High-resolution photographs and thermal imaging provide objective proof of defects
- Severity communication: Color-coded annotations and measurement data demonstrate issue significance
- Contractor quotations: Visual documentation helps builders provide accurate repair estimates
- Seller understanding: Visual evidence is harder to dismiss than written descriptions
- Solicitor support: Legal advisors can better assess risk when viewing actual conditions
For example, when a structural survey identifies significant foundation movement, providing the seller's agent with annotated photographs showing precise crack measurements, thermal imaging revealing associated dampness, and 3D models demonstrating the extent of affected areas creates a compelling case for price reduction that written descriptions alone cannot achieve.
Facilitating Post-Survey Decision Making
The period between receiving a survey report and making a final purchase decision represents a critical window where buyers consult with contractors, structural engineers, and family members. Visual reporting significantly streamlines this consultation process.
Practical applications include:
- 🔧 Contractor consultations: Builders can provide accurate quotations when viewing detailed photographs and measurements rather than interpreting written descriptions
- 👨👩👧 Family discussions: Buyers can show parents or advisors the actual property conditions, facilitating informed advice
- 🏗️ Renovation planning: Interactive 3D models help buyers visualize potential improvements and modifications
- 💰 Budget forecasting: Precise measurements enable accurate material quantity calculations for repair budgets
- ⚖️ Risk assessment: Visual severity indicators help buyers distinguish between cosmetic issues and structural concerns
Integration with Artificial Intelligence and Automated Analysis
AI-Powered Defect Detection and Classification
Artificial intelligence is embedding into core surveying workflows, with AI systems now instantly classifying terrain, identifying markers, flagging anomalies, and generating preliminary surface models from raw field data.[2] While AI adoption remains limited—only 27% of architecture, engineering, and construction respondents currently use artificial intelligence[7]—early adopters are experiencing significant benefits.
Current and emerging AI applications in building surveys:
- 🤖 Automated crack detection: AI algorithms analyze photographs to identify and measure cracks that might be missed during visual inspection
- 🌡️ Thermal anomaly flagging: Machine learning identifies unusual heat patterns indicating hidden defects
- 📊 Defect severity classification: AI systems compare current conditions against databases of similar defects to suggest severity ratings
- 📝 Report generation assistance: Natural language processing helps draft initial defect descriptions from visual data
- 🔍 Historical comparison: AI compares current survey data against previous surveys to identify progression
According to industry surveys, if costs were no object, contractors would prioritize AI adoption to augment human capabilities and automate complex workflows, alongside scanning, surveying, and positioning technologies for millimeter-level accuracy onsite.[4]
Balancing Automation with Professional Judgment
While AI offers powerful capabilities, building surveys require professional judgment that technology cannot replace. The chartered surveyor's expertise in interpreting defects within broader property context, understanding regional construction practices, and assessing risk remains essential.
The optimal approach combines:
- ✅ AI efficiency for data processing, measurement, and initial classification
- ✅ Surveyor expertise for interpretation, risk assessment, and recommendations
- ✅ Visual communication that presents both data and professional judgment clearly to clients
This hybrid model allows surveyors to focus on expertise and client relationships rather than routine data handling, while still delivering the comprehensive documentation that modern buyers expect.
Practical Implementation: Creating Effective Visual Survey Reports
Essential Equipment and Software for Modern Surveyors
Implementing Digital Tools and Visual Reporting in Building Surveys: Leveraging Laser Measurement, 3D Models, and Photography for Client Understanding requires investment in appropriate technology, though democratization is making advanced tools increasingly accessible.[3][4]
Recommended equipment tiers:
Entry Level (£2,000-5,000):
- Professional DSLR or mirrorless camera with wide-angle lens
- Laser distance meter with Bluetooth connectivity
- Thermal imaging camera attachment for smartphone
- Tablet for on-site annotation and note-taking
- Cloud-based report writing software with photo integration
Intermediate Level (£5,000-15,000):
- Professional thermal imaging camera with high resolution
- Entry-level 3D laser scanner or LiDAR-equipped tablet
- Professional drone with 4K camera for roof surveys
- Moisture meters and environmental monitoring equipment
- Dedicated survey software with 3D modeling capabilities
Advanced Level (£15,000+):
- Professional-grade 3D laser scanning system
- High-resolution thermal imaging with multiple lens options
- Professional drone with LiDAR and photogrammetry capabilities
- Integrated survey platform with AI-assisted analysis
- Cloud-based client portal with interactive 3D viewer
According to industry experts, new user-friendly scanning and positioning tools emerging in early 2026 will enable more comprehensive data collection and accuracy for faster decision-making, supporting continued democratization of advanced surveying capabilities.[4]
Best Practices for Visual Documentation
Effective visual reporting requires systematic approach:
- Comprehensive coverage: Document all defects from multiple angles and distances
- Consistent methodology: Use standardized annotation systems and color coding
- Scale references: Include measurement scales or reference objects in photographs
- Contextual shots: Show defect location within broader room or building context
- Lighting consistency: Use supplementary lighting to ensure clear, well-exposed images
- Metadata capture: Record date, time, location, and environmental conditions
- Immediate annotation: Add measurements and notes while on-site for accuracy
For commercial building surveys, where documentation requirements may be more extensive, systematic visual documentation becomes even more critical for supporting professional opinions and recommendations.
Structuring Reports for Maximum Client Comprehension
Effective visual survey reports follow clear hierarchical structure:
Executive Summary with Visual Dashboard:
- Property overview with exterior photograph
- Color-coded defect summary (urgent/monitor/minor)
- Key findings with thumbnail images
- Overall condition rating with visual indicator
Detailed Findings by Building Element:
- Section heading (e.g., "Roof Structure and Covering")
- Written assessment with technical detail
- Annotated photographs with measurement overlays
- Thermal imaging where relevant
- 3D model views showing defect locations
- Severity rating and urgency indicator
- Repair recommendations with cost guidance
Interactive 3D Model:
- Clickable markers at defect locations
- Linked to detailed photographs and descriptions
- Measurement tools for client exploration
- Layer controls for different defect types
Appendices:
- Methodology explanation
- Equipment specifications
- Surveyor qualifications
- Terms and conditions
This structure allows clients to quickly grasp overall property condition through visual summaries while providing comprehensive technical detail for those requiring deeper understanding.
Industry Trends Shaping the Future of Visual Reporting
Building Information Modeling (BIM) Integration
Building Information Modeling integration is accelerating, with land surveyors increasingly collaborating with architects, engineers, and construction professionals to integrate geospatial data directly into BIM models, which enhances project planning, reduces conflicts, and improves construction efficiency.[2][3]
While BIM adoption has been primarily driven by commercial construction, residential applications are emerging. Homebuyers planning significant renovations can benefit from survey data delivered in BIM-compatible formats that architects and contractors can directly incorporate into design workflows.
BIM integration benefits for residential surveys:
- 🏗️ Renovation planning: Existing condition data feeds directly into architectural designs
- 💰 Cost accuracy: Precise measurements enable more accurate contractor quotations
- ⚠️ Conflict detection: Identify clashes between proposed work and existing structure
- 📐 Regulatory compliance: Building control submissions benefit from accurate existing condition data
Common Data Environments and Collaborative Platforms
Rather than producing isolated plans or point clouds, surveyors are increasingly contributing to dynamic, shared environments where spatial information integrates with broader project data and informs real-time decision-making across all project stakeholders.[3]
For complex property transactions involving multiple professionals—surveyors, structural engineers, architects, solicitors—common data environments provide centralized platforms where all parties access current information, reducing miscommunication and project delays.
Features of collaborative survey platforms:
- 🔄 Real-time synchronization: All stakeholders see current information
- 💬 Integrated communication: Discussions occur within context of specific defects
- 📋 Task management: Assign follow-up actions to appropriate parties
- 🔐 Permission controls: Manage access levels for different stakeholders
- 📊 Version control: Track changes and updates throughout transaction process
Enhanced Interoperability Between Systems
Construction technology vendors are accelerating efforts to enhance interoperability and reduce friction in data handoffs, allowing survey data to integrate seamlessly regardless of which software systems clients are using—expanding potential client bases while raising expectations for data quality and formatting.[3]
This trend benefits clients who work with multiple professionals using different software platforms. Survey data that exports cleanly to various formats ensures that structural engineers, architects, and contractors can all work with the information in their preferred tools.
Case Studies: Visual Reporting in Practice
Case Study 1: Period Property with Hidden Structural Movement
Scenario: Prospective buyer commissioned a Level 3 building survey on a Victorian terrace showing minor external cracking.
Traditional approach limitations:
- Written description of "stepped cracking to rear elevation"
- Estimated crack width of "approximately 2-3mm"
- Recommendation for "monitoring" without clear baseline
Digital tools implementation:
- Laser measurement documented precise crack widths (2.1mm to 3.4mm at different points)
- 3D laser scan created complete baseline for future monitoring
- Thermal imaging revealed associated dampness invisible to naked eye
- Drone survey identified corresponding roof distortion
- Annotated photographs showed crack progression from ground to roof level
Client outcome:
The comprehensive visual documentation enabled the buyer to obtain three contractor quotations for underpinning work, negotiate a £35,000 price reduction, and establish clear monitoring protocols with the surveyor. The 3D baseline scan provided objective data for future comparison, eliminating ambiguity about whether movement was ongoing or historic.
Case Study 2: Modern Property with Concealed Defects
Scenario: Recently decorated property appeared in excellent condition during viewings, but buyer requested comprehensive survey.
Traditional approach limitations:
- Surface inspection might miss concealed issues
- Written descriptions of "potential concerns" lack compelling evidence
- Difficult to justify price negotiation without clear proof
Digital tools implementation:
- Thermal imaging revealed extensive cold bridging and insulation defects hidden behind fresh decoration
- Moisture meter data mapped dampness patterns suggesting failed damp-proof course
- High-resolution photography with measurement overlays documented window seal failures
- Annotated floor plans showed distribution of defects throughout property
Client outcome:
Visual evidence proved that cosmetic decoration concealed significant defects. The buyer presented the thermal imaging and annotated photographs to the seller's agent, resulting in a £22,000 price reduction to cover remedial works. The visual documentation also helped the buyer obtain accurate contractor quotations and plan renovation priorities.
Case Study 3: Commercial Property Acquisition
Scenario: Business purchasing commercial premises required comprehensive condition assessment for investment decision.
Traditional approach limitations:
- Large property with multiple defects difficult to communicate clearly
- Stakeholders (investors, lenders, solicitors) need accessible information
- Ongoing monitoring requirements for long-term asset management
Digital tools implementation:
- Complete 3D laser scan of entire building
- Drone survey of extensive roof areas
- Interactive digital report with clickable defect markers
- Color-coded severity system (red/amber/green)
- Cloud-based platform accessible to all stakeholders
- BIM-compatible data export for future renovation planning
Client outcome:
The interactive platform enabled all stakeholders to review findings independently, accelerating decision-making. The 3D model supported renovation planning, and the BIM-compatible export allowed the client's architects to begin design work immediately. The comprehensive visual documentation also satisfied lender requirements and provided baseline data for ongoing asset management.
Addressing Client Concerns and Questions
"How Much Do Digital Survey Tools Add to Survey Costs?"
Transparent cost considerations:
The implementation of digital tools does involve equipment investment and additional survey time, but the value delivered typically justifies modest cost increases. Many surveyors include basic digital documentation (high-resolution photography, laser measurements) as standard in RICS home surveys, with premium services (3D scanning, drone surveys, thermal imaging) available as optional upgrades.
Typical cost structure:
- Standard survey with enhanced photography and laser measurement: Baseline cost
- Addition of comprehensive thermal imaging: +£150-300
- Drone roof survey: +£200-400
- 3D laser scanning: +£300-600
- Interactive digital report platform: Often included, or +£100-200
The investment frequently pays for itself through improved negotiation outcomes, more accurate contractor quotations, and reduced post-purchase surprises.
"Can I Access Visual Survey Data After Purchase?"
Long-term value of digital documentation:
Quality survey providers offer ongoing access to digital survey data through cloud platforms, providing lasting value beyond the initial transaction. This access proves particularly valuable for:
- 📋 Renovation planning: Reference precise measurements and condition data
- 🔧 Contractor briefings: Share specific defect information for quotations
- 📊 Insurance claims: Provide baseline condition documentation
- 🏠 Future sales: Demonstrate property history and completed works
- 🔍 Monitoring: Compare current conditions against survey baseline
Ensure your surveyor provides permanent access to digital assets rather than time-limited viewing windows.
"How Reliable Are AI-Assisted Survey Tools?"
Understanding AI capabilities and limitations:
AI tools augment rather than replace professional surveyor judgment. Current AI applications excel at:
- ✅ Data processing and measurement automation
- ✅ Pattern recognition for common defect types
- ✅ Anomaly flagging for surveyor review
- ✅ Measurement accuracy and consistency
However, AI cannot replace:
- ❌ Professional interpretation of defect significance
- ❌ Understanding of regional construction practices
- ❌ Risk assessment within property transaction context
- ❌ Nuanced recommendations based on client circumstances
The most effective approach combines AI efficiency for data handling with chartered surveyor expertise for interpretation and advice.
Selecting a Surveyor with Advanced Digital Capabilities
Key Questions to Ask Prospective Surveyors
When commissioning a survey, ask:
-
"What digital tools do you use for measurement and documentation?"
- Look for: Laser measurement, thermal imaging, professional photography
- Bonus: 3D scanning, drone capabilities, moisture mapping
-
"How will defects be presented in the report?"
- Look for: Annotated photographs, measurement overlays, severity indicators
- Bonus: Interactive 3D models, clickable defect markers, thermal imaging integration
-
"Can I access the report digitally and share it with advisors?"
- Look for: Cloud-based platform, mobile-responsive design, shareable links
- Bonus: Integrated commenting, downloadable sections, permanent access
-
"Do you provide baseline data for future monitoring?"
- Look for: Precise measurements, dated photographs, condition documentation
- Bonus: 3D scan data, BIM-compatible exports, monitoring protocols
-
"What format will photographs and visual data be delivered in?"
- Look for: High-resolution images, organized by building element, annotated
- Bonus: RAW image files, 360-degree photography, video walkthroughs
Professional Qualifications and Technology Expertise
Ensure your surveyor combines:
- 🎓 Professional qualifications: RICS chartered status (AssocRICS or MRICS)
- 🏢 Relevant experience: Track record in your property type and age
- 💻 Technology competency: Demonstrated capability with digital tools
- 📚 Continuing development: Ongoing training in emerging technologies
- 🔍 Professional indemnity insurance: Adequate coverage for advice provided
The ideal surveyor balances traditional building pathology expertise with modern technological capabilities, delivering comprehensive assessments communicated through accessible visual formats.
Conclusion: The Future of Client-Centered Survey Reporting
Digital Tools and Visual Reporting in Building Surveys: Leveraging Laser Measurement, 3D Models, and Photography for Client Understanding represents far more than technological advancement—it fundamentally transforms the surveyor-client relationship from information provider to collaborative advisor. By translating technical findings into visual formats that anyone can comprehend, modern surveyors empower clients to make confident, informed decisions about the most significant financial transactions of their lives.
The democratization of reality capture technology, combined with improving interoperability and emerging AI capabilities, ensures that visual reporting will become standard practice rather than premium service. Clients in 2026 increasingly expect—and deserve—survey deliverables that leverage modern technology to provide clarity, precision, and actionable insight.
Actionable Next Steps
For property buyers:
- Request visual documentation when commissioning surveys—ask specifically about photography, thermal imaging, and measurement technology
- Review sample reports from prospective surveyors to assess visual reporting quality
- Plan for digital access by ensuring you'll receive permanent access to visual data for future reference
- Share visual findings with contractors to obtain accurate repair quotations before finalizing purchases
- Use interactive features to explore defects thoroughly and ask informed questions
For surveying professionals:
- Invest strategically in digital tools appropriate to your practice scale and client base
- Develop workflows that integrate visual documentation efficiently into existing survey processes
- Train continuously on emerging technologies and visualization techniques
- Communicate value by showing clients how visual reporting supports better decision-making
- Embrace interoperability by delivering data in formats that integrate with client workflows
For the industry:
- Establish standards for visual reporting quality and consistency
- Promote accessibility by making digital tools available to firms of all sizes
- Encourage innovation while maintaining professional standards and judgment
- Support training in both traditional surveying skills and modern technology
- Prioritize client understanding as the ultimate measure of reporting effectiveness
The transformation from text-heavy reports to visual, interactive deliverables isn't just about technology—it's about ensuring that every property buyer can understand their survey findings clearly, negotiate confidently, and make informed decisions. As digital tools continue to evolve and democratize, the surveying profession has an opportunity to enhance its value proposition while delivering genuinely better outcomes for clients navigating complex property transactions.
The future of building surveys is visual, interactive, and client-centered. Surveyors who embrace Digital Tools and Visual Reporting in Building Surveys: Leveraging Laser Measurement, 3D Models, and Photography for Client Understanding position themselves not just as measurement professionals, but as essential advisors who translate complex building conditions into clear, actionable intelligence that empowers confident decision-making.
References
[1] Digital Construction Tools – https://www.planera.io/post/digital-construction-tools
[2] Future Land Surveying 2026 – https://haller-blanchard.com/future-land-surveying-2026/
[3] Doubling Down On Digital – https://amerisurv.com/2026/02/01/doubling-down-on-digital/
[4] Future Construction Technology Trends Contractor Survey – https://www.trimble.com/blog/trimble/en-US/article/future-construction-technology-trends-contractor-survey
[7] Architecture Engineering Construction Sector Slow To Adapt Ai Survey Shows – https://www.asce.org/publications-and-news/civil-engineering-source/article/2025/12/18/architecture-engineering-construction-sector-slow-to-adapt-ai-survey-shows