
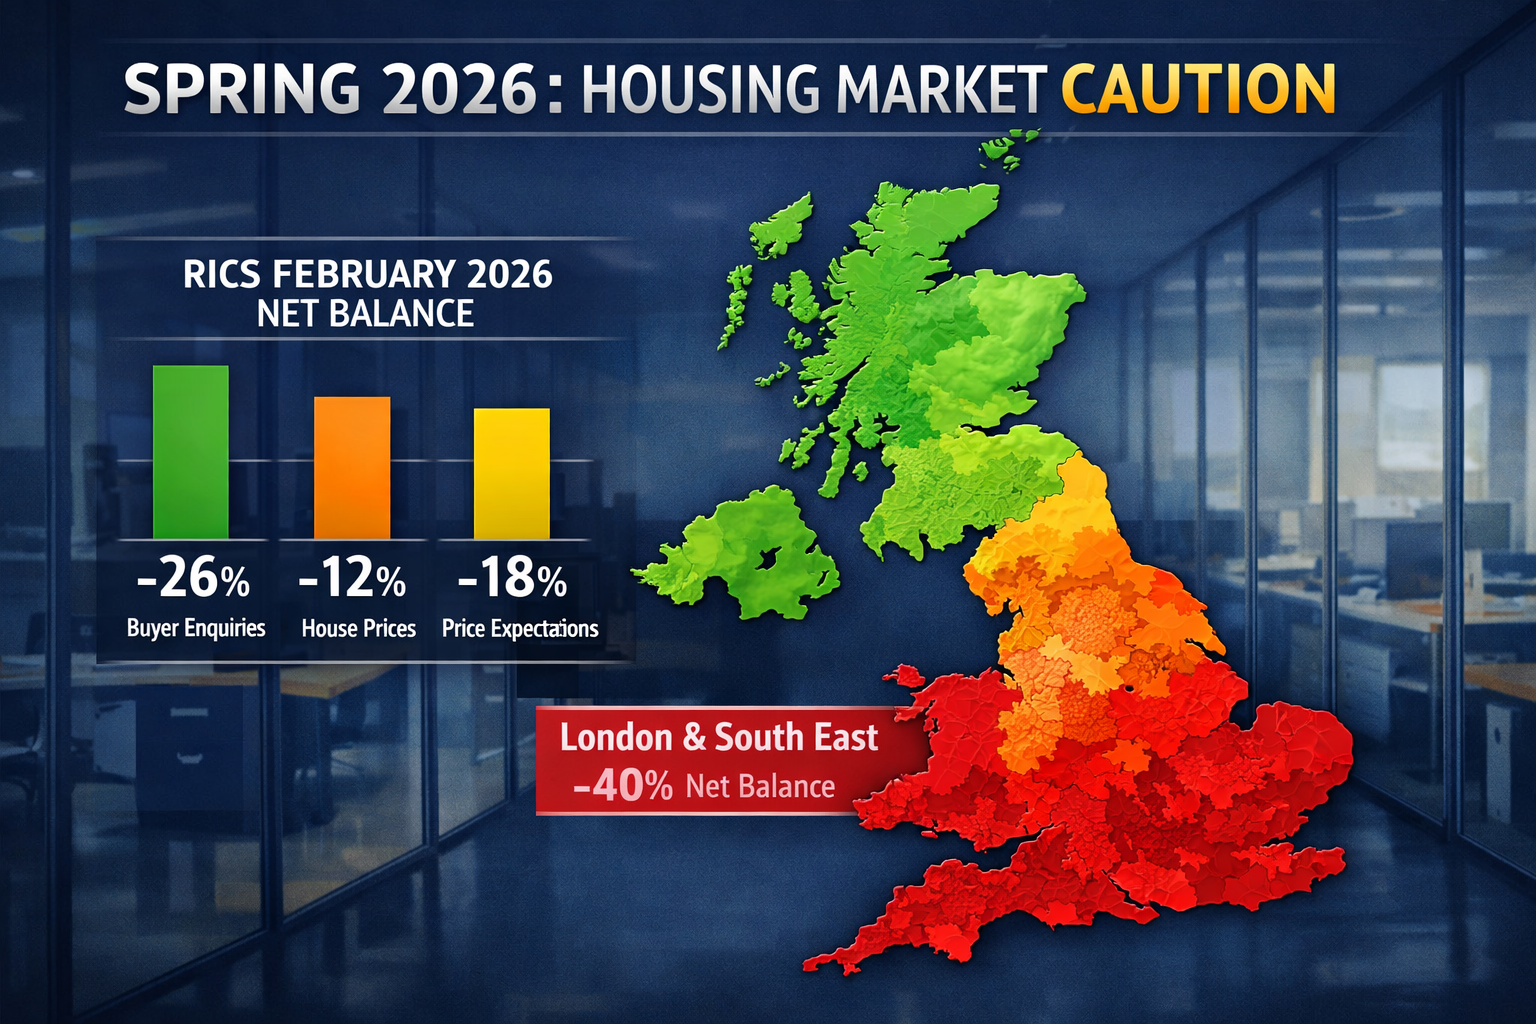
A net balance of -26% of RICS survey respondents reported falling buyer enquiries in February 2026 — and by March, that figure had collapsed further to -39%, the weakest reading since summer 2023. For building surveyors navigating client expectations and defending valuations in an increasingly fractious market, the Spring 2026 Market Caution and Regional Divergence: Valuation Red Flags from RICS February Data for Building Surveyors represents more than a headline statistic. It is a professional call to action.
The RICS February 2026 UK Residential Market Survey paints a picture of a market under mounting pressure: flat national prices masking severe regional splits, deteriorating short-term sentiment, and a rental sector in structural imbalance. For surveyors, the challenge is not simply recognising these signals — it is building the professional frameworks to act on them responsibly, communicate caution clearly to clients, and defend valuations robustly when disputes arise. [1]
Key Takeaways 📋
- Buyer demand is deteriorating rapidly: From -15% in January to -26% in February and -39% in March 2026, the direction of travel is unambiguous.
- London is the epicentre of price weakness: A -40% net balance on house prices in February makes London the most vulnerable region for downward valuation pressure.
- National figures mask deep regional divergence: Northern Ireland, Scotland, and the North West are outperforming while the South and East underperform significantly.
- Rental market imbalance is intensifying: Landlord instructions at -27% versus stable tenant demand signals continued rental inflation despite sales market weakness.
- Surveyors need structured frameworks: Responsible downward valuation adjustments, clear client communication, and defensible methodology are the professional imperatives of Spring 2026.
Understanding the RICS February 2026 Data: What the Numbers Actually Mean
Before translating data into valuation practice, it is worth understanding precisely what RICS net balance figures represent. A net balance is the percentage of respondents reporting an increase minus those reporting a decrease. A reading of -26% on buyer enquiries, therefore, means substantially more surveyors observed falling demand than rising demand — not that enquiries fell by 26%. The signal is directional and sentiment-based, but it is consistently one of the most reliable leading indicators of market turning points. [2]
The Demand Collapse in Context
The deterioration in buyer enquiries across early 2026 follows a pattern that building surveyors should treat as a structured warning sequence:
| Month | Buyer Enquiries Net Balance | Near-Term Price Expectations |
|---|---|---|
| January 2026 | -15% | -6% |
| February 2026 | -26% | -18% |
| March 2026 | -39% | (accelerating) |
Sources: [1][4]
This is not a minor seasonal blip. The acceleration from January through March represents a sustained deterioration in buyer confidence driven by two compounding forces: renewed concerns over the interest rate outlook and macro-related fallout linked to geopolitical tensions in the Middle East, which RICS explicitly identifies as intensifying inflationary pressures and pushing borrowing costs higher. [4]
💬 "The direction of travel in buyer sentiment is now unambiguous — and surveyors who fail to factor this into their valuation methodology risk producing figures that are out of step with market reality."
Agreed sales remained subdued throughout February, posting a net balance of -12%, while near-term sales expectations plummeted to -33% by March — a dramatic reversal from the broadly neutral -2% recorded just one month earlier. [1][4]
The Twelve-Month Picture: Cautious Optimism or False Comfort?
One nuance that surveyors must handle carefully with clients is the divergence between short-term and long-term expectations. Despite the sharp deterioration in near-term sentiment, a net balance of +33% of survey respondents still expected prices to edge higher over a 12-month horizon in February. [1] By March, however, the 12-month sales expectations balance had shifted to a broadly flat -1%, a significant reversal from February's positive +17%. [4]
This tension — between residual long-term optimism and accelerating short-term pessimism — is precisely the kind of nuanced market condition that makes RICS-registered valuers indispensable. A client who anchors on the 12-month optimism figure while ignoring the near-term collapse is making a potentially costly error. Surveyors have a professional duty to present both dimensions clearly.
Regional Divergence: The Valuation Red Flags Building Surveyors Cannot Ignore

The Spring 2026 Market Caution and Regional Divergence: Valuation Red Flags from RICS February Data for Building Surveyors is perhaps most starkly illustrated at the regional level. The national headline figure of -12% on house prices in February 2026 is, in isolation, misleading. [1] Beneath it lies a market that is fracturing along geographic lines with unusual severity.
London and the South: Where Valuation Risk Is Highest 🔴
The regional breakdown from February 2026 reveals a clear hierarchy of underperformance:
- London: -40% net balance on house prices — the most pronounced weakness in the country
- East Anglia: -26% net balance
- South East: -24% net balance
These are not marginal readings. A -40% net balance in London means an overwhelming majority of RICS surveyors in the capital are observing price falls, not rises. For any building surveyor working on RICS Level 3 Building Surveys or formal valuations in London, this data demands active consideration in comparable selection, market commentary, and any assumptions about achievable sale prices. [1]
The pressure is particularly acute in premium London markets. Surveyors operating across central London and South East London should be stress-testing their comparable evidence with particular rigour, given the speed at which sentiment has deteriorated.
The Outperforming Regions: A Different Valuation Environment 🟢
In contrast, several regions are demonstrating firmer trends:
- Northern Ireland: Positive net balance — strongest performer nationally
- Scotland: Positive net balance
- North West England: Relatively firm conditions
This divergence has direct implications for how surveyors approach methods of valuation in different parts of the country. A comparable-based approach that draws on national averages or even regional indices without granular local adjustment risks systematic error in both directions — overvaluing in London and undervaluing in stronger northern markets.
Practical Implications for Comparable Selection
When regional divergence is this pronounced, surveyors should apply the following discipline to comparable evidence:
- Restrict comparable timeframes: In falling markets, comparables older than three months may overstate value. In February-March 2026 conditions, this window may need to compress further.
- Apply directional adjustments: Where the RICS net balance is strongly negative, a downward adjustment to comparable evidence may be professionally justified and should be documented.
- Weight recent exchange prices over asking prices: Asking prices lag market reality in falling conditions. Exchange prices are the ground truth.
- Document market commentary explicitly: Any valuation report produced in Spring 2026 should include a clear statement of prevailing market conditions and their influence on the opinion of value.
For surveyors producing Red Book valuations, the RICS Valuation — Global Standards require that market conditions be explicitly considered. The February 2026 data provides the evidential basis for that consideration.
Frameworks for Responsible Valuation Practice in a Cautious Spring 2026 Market

Navigating the Spring 2026 Market Caution and Regional Divergence: Valuation Red Flags from RICS February Data for Building Surveyors requires more than awareness of the data — it demands structured professional responses across three core areas: valuation methodology, client communication, and dispute defence.
Adjusting Valuations Downward: A Methodological Framework
Downward valuation adjustments are professionally and legally defensible only when they are grounded in documented evidence and explicit methodology. In the current environment, surveyors should consider the following framework:
Step 1 — Establish the market conditions baseline
Use RICS survey data (February and March 2026), Land Registry price paid data, and local agent intelligence to establish a documented picture of current market conditions. Note the specific net balance figures relevant to the subject property's region.
Step 2 — Assess comparable quality
For each comparable used, assess its date, location, and condition relative to the subject. In a market where buyer enquiries have fallen from -15% to -39% in three months, a comparable from Q4 2025 may require a downward time adjustment.
Step 3 — Apply and document adjustments
Any adjustment — whether for time, condition, or market sentiment — must be explicitly stated in the valuation report with its rationale. Vague references to "market conditions" are insufficient; specific data points from sources such as the RICS February 2026 survey provide the professional foundation. [1][2]
Step 4 — State assumptions and caveats clearly
Given the macro uncertainty identified in the March 2026 RICS survey — geopolitical tensions, inflationary pressures, borrowing cost trajectory — valuations in Spring 2026 should carry explicit caveats about the sensitivity of the opinion of value to these factors. [4]
Communicating Caution to Clients: Getting the Message Right
One of the most challenging aspects of a deteriorating market is managing client expectations without creating unnecessary alarm. The following communication principles apply:
- Lead with data, not opinion: Presenting RICS net balance figures as objective third-party evidence depersonalises difficult messages and grounds the conversation in fact.
- Distinguish short-term from long-term: The tension between the -18% near-term price expectation and the +33% 12-month outlook [1] is a useful framework for explaining that caution is not the same as catastrophe.
- Be explicit about regional context: A client purchasing in London needs to understand that the -40% net balance in their region is materially different from the national picture.
- Document all client communications: In a market where valuations may be challenged, a clear record of the advice given — and the data underpinning it — is essential professional protection.
For clients considering choosing the right property survey, the current market conditions make comprehensive survey coverage more important than ever. Structural defects, condition issues, and hidden costs that buyers might have overlooked in a rising market become significant renegotiation levers — or deal-breakers — when sentiment is weak.
Defending Valuations in Disputes
In a falling market, the risk of valuation disputes increases. Buyers who overpay relative to a rapidly declining market, or lenders whose security is eroded, may seek to challenge surveyor opinions of value. The defence framework rests on three pillars:
1. Contemporaneous documentation 📄
Every valuation produced in Spring 2026 should be supported by a documented file note recording the market evidence reviewed, the comparables considered and rejected, and the rationale for any adjustments. RICS survey data should be explicitly referenced.
2. Methodology transparency
The valuation factors considered — location, condition, tenure, market sentiment — should be clearly articulated. Opaque methodology is the most common vulnerability in valuation disputes.
3. Professional indemnity awareness
Surveyors should review their professional indemnity position in light of current market volatility. The combination of rapidly deteriorating buyer sentiment, sharp regional divergence, and macro uncertainty creates an elevated dispute environment.
The Rental Market Imbalance: A Parallel Risk for Surveyors
While the sales market captures most attention, the rental sector presents its own set of valuation challenges in Spring 2026. The RICS February 2026 data reveals a structural imbalance that shows no signs of resolving:
- Tenant demand: +2% net balance (stable) [1]
- Landlord instructions: -27% net balance (firmly negative) [1]
- Near-term rent expectations: +20% of survey participants expecting rents to rise [1]
This imbalance — stable demand against sharply falling supply — is driving rental inflation even as the sales market weakens. For surveyors involved in rent review work or investment property valuations, this creates a bifurcated picture: capital values under pressure, but income yields potentially rising.
The practical implication for investment valuations is significant. A property whose capital value is being marked down by sales market weakness may simultaneously command a higher rental income, partially offsetting the yield impact. Surveyors must model both dimensions carefully and avoid the error of applying sales market pessimism uniformly to income-producing assets without considering the rental supply-demand dynamic.
Macroeconomic Headwinds: What Surveyors Should Monitor Through Spring 2026
The RICS March 2026 survey is explicit about the macro drivers of current market weakness: geopolitical tensions in the Middle East combined with intensifying inflationary pressures pushing borrowing costs higher. [4] For building surveyors, these are not abstract economic forces — they translate directly into the conditions under which valuations are produced and challenged.
Key indicators to monitor:
| Indicator | Current Signal | Valuation Implication |
|---|---|---|
| Bank of England base rate trajectory | Upward pressure | Reduces buyer affordability; supports lower valuations |
| Mortgage approval volumes | Declining | Confirms demand weakness; supports cautious comparables |
| RICS buyer enquiries | -39% (March 2026) | Leading indicator of further price pressure |
| New instructions | -6% (March 2026) | Falling supply may limit price falls but reduces transaction evidence |
| 12-month price expectations | -1% (March 2026) | Market expects stagnation, not recovery |
Sources: [1][4]
New property listings, which registered a broadly neutral +2% in February, deteriorated to -6% by March 2026. [4] Falling supply can act as a partial brake on price declines, but in a market where buyer demand is collapsing faster than supply, it is unlikely to prevent further softening — particularly in London and the South East.
Conclusion: Actionable Steps for Building Surveyors This Spring 2026
The data is unambiguous. Spring 2026 brings a market characterised by accelerating demand weakness, sharp regional divergence, and macro uncertainty that shows no immediate signs of resolution. For building surveyors, the professional response must be structured, documented, and proactive.
Actionable next steps for Spring 2026:
✅ Update your market conditions file — Compile the RICS February and March 2026 survey data into a reference document that can be cited in valuation reports and client communications.
✅ Review comparable timeframes — In London, the South East, and East Anglia, tighten comparable windows and apply documented time adjustments where evidence supports downward pressure.
✅ Strengthen client communication protocols — Develop a standard market conditions briefing note that can be shared with clients at instruction stage, setting expectations before the valuation is delivered.
✅ Audit your valuation file documentation — Ensure every Spring 2026 valuation file contains explicit market commentary, documented comparable rationale, and clear caveats about macro sensitivity.
✅ Consider survey scope carefully — In a market where buyers are increasingly cautious, recommending a RICS Level 3 Building Survey over a lighter-touch inspection provides clients with the comprehensive condition information they need to make informed decisions in uncertain conditions.
✅ Engage with regional data — Do not apply national sentiment to regional valuations. The gap between London (-40%) and Northern Ireland (positive) is too wide for a uniform approach.
The Spring 2026 Market Caution and Regional Divergence: Valuation Red Flags from RICS February Data for Building Surveyors is not a reason for paralysis — it is a framework for professional precision. Surveyors who respond with rigour, transparency, and documented methodology will not only protect their clients but will build the professional reputation that endures beyond any single market cycle.
References
[1] UK Residential Survey February 2026 – https://www.rics.org/news-insights/uk-residential-survey-february-2026
[2] UK Residential Market Survey February 2026 – https://www.rics.org/content/dam/ricsglobal/documents/market-surveys/uk-residential-market-survey/UK-Residential-Market-Survey_February-2026.pdf
[3] UK RICS Residential Market Survey Feb 2026 – https://www.capitaleconomics.com/publications/uk-housing-market-update/uk-rics-residential-market-survey-feb-2026
[4] UK Residential Market Survey March 2026 – https://www.rics.org/content/dam/ricsglobal/documents/market-surveys/uk-residential-market-survey/UK-Residential-Market-Survey-March-2026.pdf
[5] The Market View February 2026 – https://www.watsons-property.co.uk/the-market-view-february-2026/