
nn
The property market landscape in 2026 is experiencing a fundamental shift that demands immediate attention from valuation professionals. As affordability concerns reshape buyer behaviour and builder confidence wavers, surveyors face an unprecedented challenge: recalibrating traditional valuation methodologies to accurately reflect the surging demand for lower and middle-priced properties. With home prices having climbed 53% since 2019 while median household incomes increased only 24%, the affordability gap has created distinct market segments that require different valuation approaches[3]. Understanding Affordability-Led Valuation Adjustments 2026: How Surveyors Must Recalibrate for Lower-Priced Property Demand Surge is no longer optional—it's essential for maintaining professional credibility and delivering accurate property assessments.
Key Takeaways
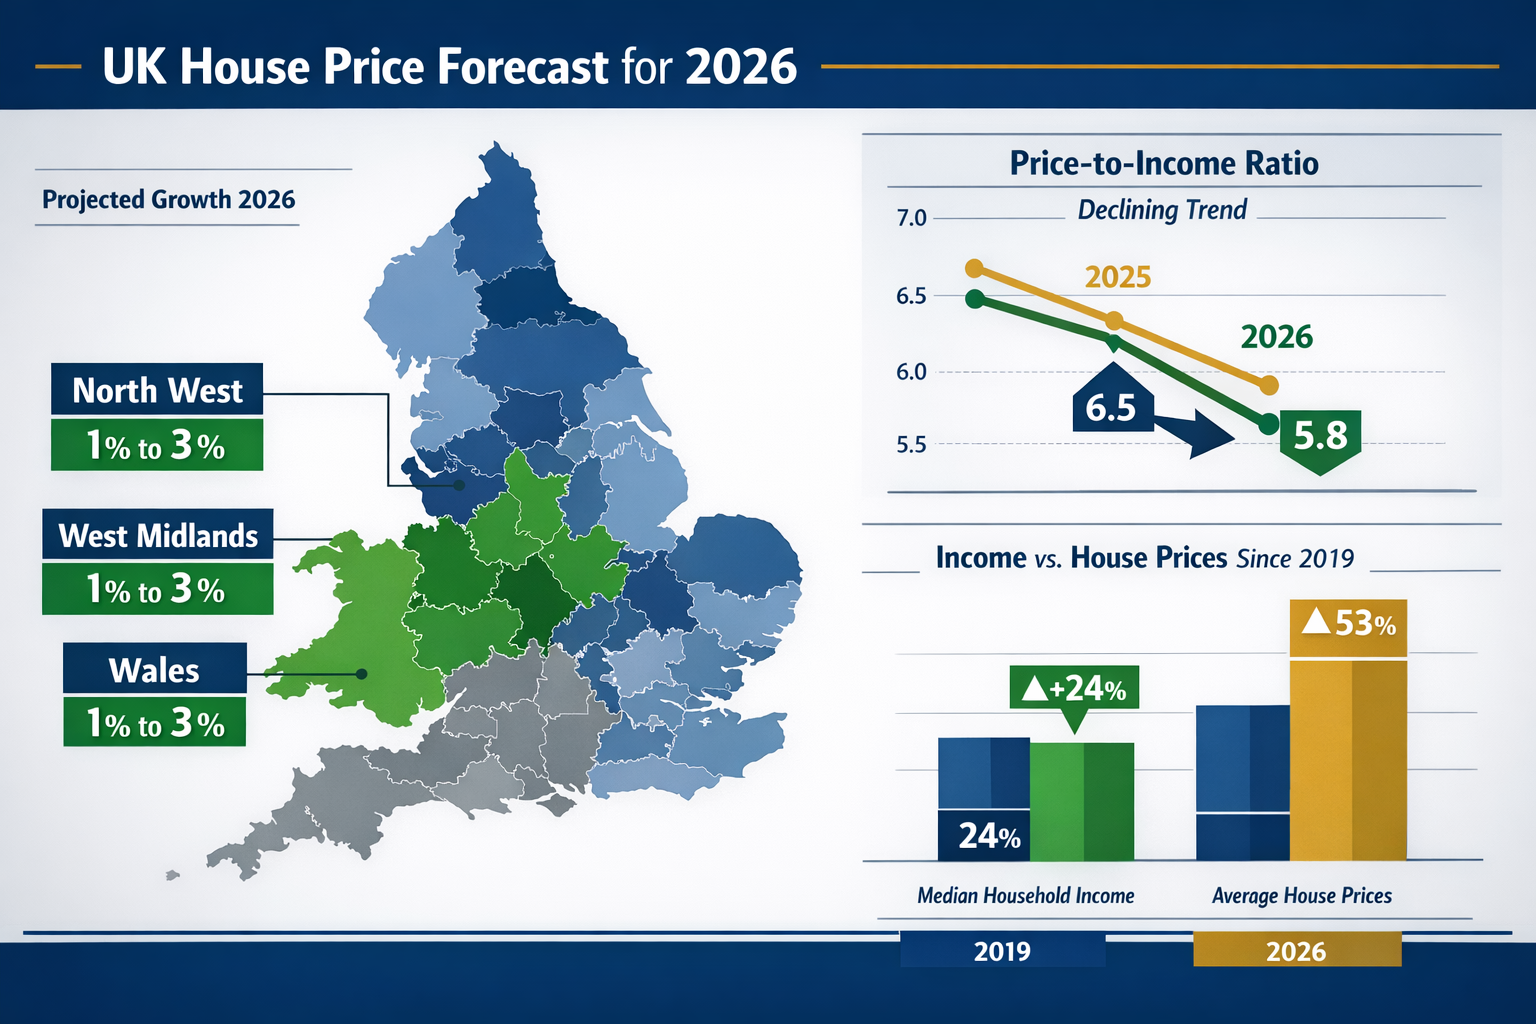
- 🏘️ Regional variations matter: Modest 1-3% house price growth is forecast for affordability-improved regions like West Midlands, North West, and Wales in 2026
- 📊 Builder confidence signals market shift: The NAHB/Wells Fargo Housing Market Index fell to 36 in February 2026, with 67% of builders now offering sales incentives to combat affordability concerns
- 💷 Price-to-income gap creates valuation challenges: The 53% home price increase versus 24% income growth since 2019 demands new valuation frameworks
- 🎯 Segment-specific approaches required: Entry-level and mid-range properties require different valuation considerations than higher-end homes
- ⚡ Practical features drive value: Flexible spaces, energy efficiency, and practical layouts now significantly influence valuations in the affordable segment
Understanding the Affordability Crisis Reshaping Property Valuations
The property market in 2026 operates under dramatically different conditions than just five years ago. The affordability crisis has fundamentally altered buyer priorities, builder strategies, and ultimately, how surveyors must approach property valuations.
The Numbers Behind the Affordability Challenge
Builder confidence has become a leading indicator of market conditions. In February 2026, the NAHB/Wells Fargo Housing Market Index registered at 36—a one-point decline from January and the second consecutive monthly drop[1]. This decline wasn't random; it directly reflected mounting affordability concerns that have reshaped the entire housing ecosystem.
The statistics paint a clear picture:
| Metric | Current Status (2026) | Impact on Valuations |
|---|---|---|
| Home Price Growth Since 2019 | +53% | Creates significant overvaluation risk in traditional comps |
| Median Income Growth Since 2019 | +24% | Limits buyer purchasing power in middle segments |
| Builders Offering Incentives | 67% | Suggests actual transaction prices below asking |
| Average Price Reduction | 6% | Must be factored into comparable sales analysis |
| Prospective Buyer Traffic Index | 22 points | Indicates weakening near-term demand |
These figures demonstrate why traditional valuation methods require immediate recalibration. When two-thirds of builders are offering incentives and buyer traffic remains historically low, surveyors cannot rely solely on asking prices or even recent sales without significant adjustment.
Geographic Disparities in Affordability
The affordability challenge manifests differently across regions. The South region's HMI three-month average dropped to 35, while the West fell to 33—the two lowest-performing regions[1]. Meanwhile, the Northeast and Midwest held at 43, suggesting relatively more stable valuation environments.
Regional breakdown for surveyors:
- West Midlands, North West, Wales: Forecasted 1-3% growth driven by improved affordability ratios[2]
- Southern markets: Continued affordability pressure limiting price appreciation
- Western regions: Highest affordability challenges requiring most significant valuation adjustments
- Northeast/Midwest: More balanced price-to-income ratios supporting traditional methodologies
For surveyors conducting Canterbury property valuations or assessments in similar markets, understanding these regional variations is critical. A property in the West Midlands may warrant different affordability adjustments than a comparable home in the South.
The Builder Response and Its Valuation Implications
Builders have responded to affordability concerns with aggressive incentive programmes. Sales incentive usage held at 65% in February 2026, marking the 11th consecutive month exceeding 60%[1]. This persistent pattern signals a structural market shift rather than temporary adjustment.
Common builder incentives affecting valuations:
✅ Mortgage rate buy-downs (reducing effective buyer cost)
✅ Closing cost assistance (lowering transaction barriers)
✅ Upgraded finishes at no additional cost (increasing actual value delivered)
✅ Flexible payment terms (altering effective pricing)
✅ Price reductions (direct impact on comparable sales)
When 41% of builders have cut prices compared to previous years[3], surveyors must carefully analyse whether comparable sales reflect true market value or incentive-adjusted pricing. The price of valuation services themselves may need adjustment to account for the additional analysis required.
Affordability-Led Valuation Adjustments 2026: Recalibrating Methodology for Market Realities
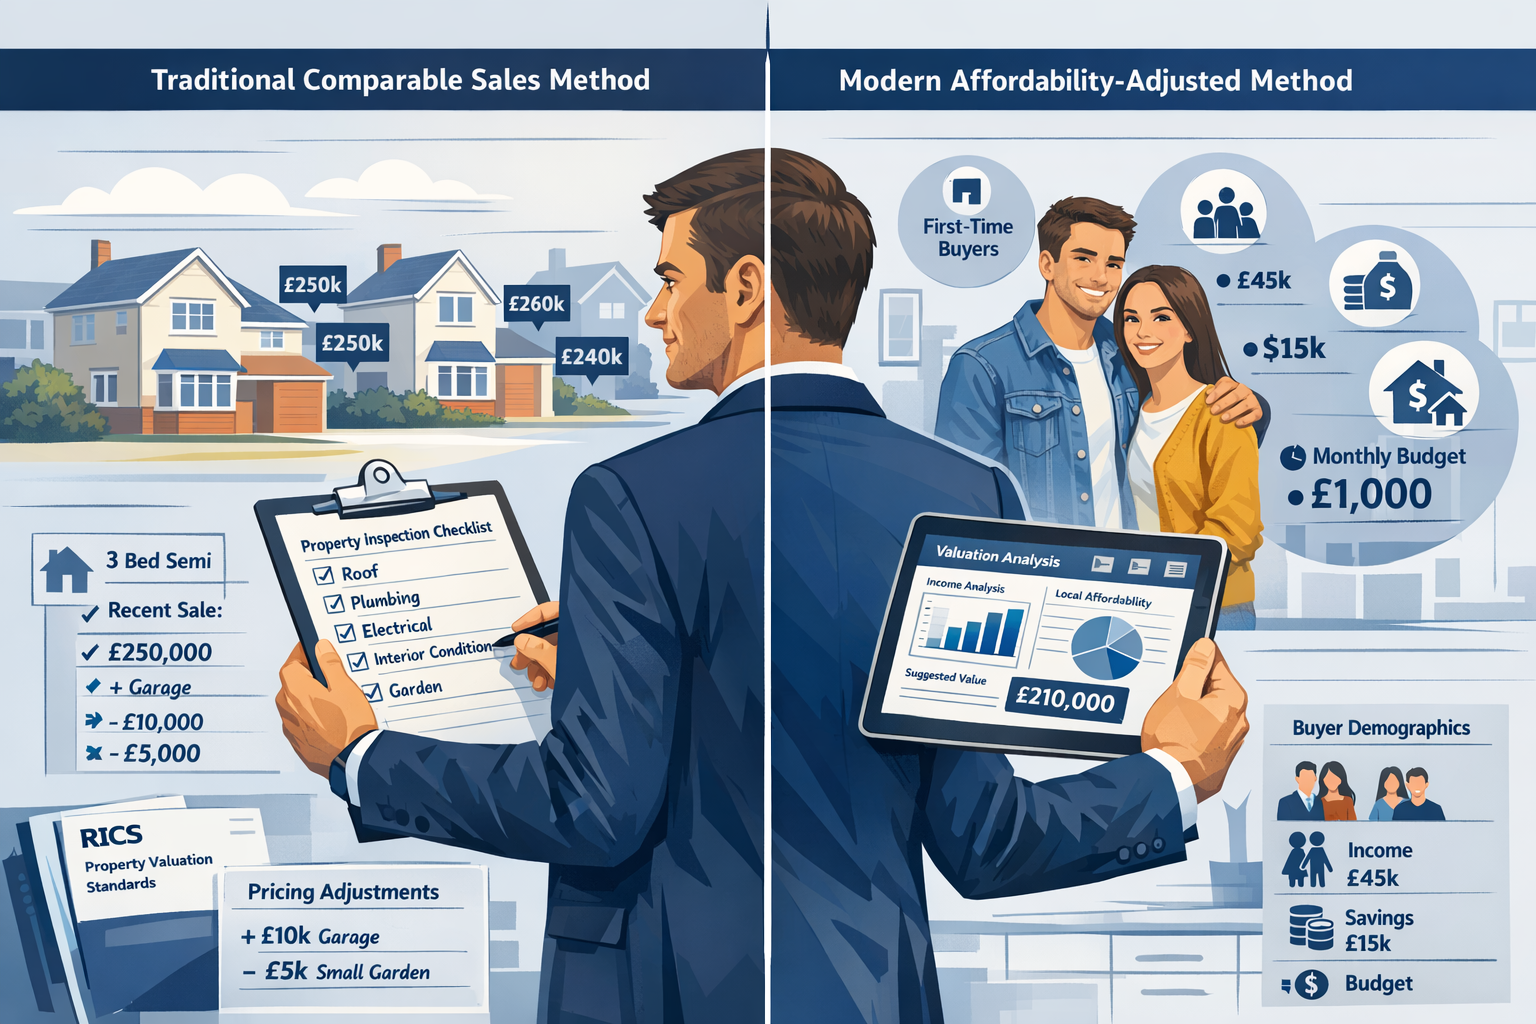
Traditional valuation approaches assume relatively stable market conditions and rational price-to-income relationships. The 2026 market violates both assumptions, requiring surveyors to adopt affordability-led valuation adjustments that reflect actual buyer capacity and market segmentation.
Segment-Specific Valuation Frameworks
The affordability crisis has created distinct property segments with different valuation dynamics. Entry-level buyers prioritize value and practical layouts, while higher-end buyers seek extra bedrooms, home offices, energy-efficient features, and community amenities[3]. This divergence demands segment-specific approaches.
Entry-Level Property Valuations (Under £250,000)
For affordable properties, strong first-time buyer demand in affordable regions is keeping entry-level prices firm and providing a valuation floor for the overall market[2]. Surveyors should:
- Weight recent transactions heavily: First-time buyer activity creates reliable comparable sales
- Adjust for practical features: Flexible spaces, drop zones, and multi-purpose rooms add measurable value
- Consider regional affordability improvements: Apply positive adjustments in West Midlands, North West, Wales
- Factor in government schemes: Help to Buy valuations require specific considerations
- Account for builder incentives: Reduce comparable prices by estimated incentive value
Mid-Range Property Valuations (£250,000-£500,000)
The middle segment faces the greatest affordability pressure, as buyers stretch beyond entry-level but cannot access luxury pricing. Key adjustments include:
- Income-based ceiling analysis: Calculate maximum supportable price based on regional median incomes
- Competitive positioning: Value relative to entry-level alternatives plus meaningful upgrades
- Feature premium justification: Quantify value of home offices, energy efficiency, additional bedrooms
- Market time adjustments: Longer selling periods indicate overvaluation requiring downward revision
Upper-Tier Property Valuations (Above £500,000)
Higher-end properties operate in less affordability-constrained segments but face different challenges:
- Less comparable transaction data
- Buyer pool limitations
- Feature-specific valuations for premium amenities
- Location premium calculations
For complex situations requiring specialized expertise, registered RICS valuers provide the professional standards necessary for defensible valuations.
Incorporating Builder Incentive Adjustments
With price-cutting incidence at 36% in February (down from 40% in January) but average reductions steady at 6%[1], surveyors must systematically adjust comparable sales for incentive effects.
Incentive Adjustment Framework:
Adjusted Sale Price = Stated Sale Price - Incentive Value + Market Position Adjustment

Where:
- Incentive Value = Estimated cost of rate buy-downs, closing costs, upgrades
- Market Position Adjustment = Regional demand factor (positive in improving markets)
Example calculation:
| Component | Amount |
|---|---|
| Stated Sale Price | £300,000 |
| Mortgage Rate Buy-Down (2% for 2 years) | -£8,000 |
| Closing Cost Assistance | -£3,000 |
| Upgraded Appliances | -£2,500 |
| Adjusted Comparable Price | £286,500 |
| Regional Demand Improvement (West Midlands +2%) | +£5,730 |
| Final Adjusted Comparable | £292,230 |
This systematic approach ensures valuation reports in Canterbury and elsewhere accurately reflect true market conditions rather than artificially inflated asking prices.
Energy Efficiency and Practical Feature Premiums
Builders are adding flexible spaces, drop zones, multi-purpose rooms, and electric vehicle charging stations to address affordability concerns without significant price increases[3]. These features now command measurable valuation premiums, particularly in the entry-level and mid-range segments.
Feature valuation premiums (2026 market):
🔋 EV Charging Station: +£2,000-£3,500 (higher in urban areas)
🏠 Multi-Purpose Room/Flex Space: +£3,000-£5,000 (depends on size and configuration)
📦 Drop Zone/Mudroom: +£1,500-£2,500 (practical value for families)
⚡ Enhanced Energy Efficiency: +£5,000-£15,000 (based on EPC improvement and projected savings)
💼 Dedicated Home Office: +£4,000-£8,000 (post-pandemic workspace premium)
These premiums reflect actual buyer willingness to pay and should be applied when comparable properties lack these features. The key is ensuring adjustments reflect genuine market behaviour rather than theoretical value.
Practical Implementation: How Surveyors Must Adapt Their Practice in 2026
Understanding the need for Affordability-Led Valuation Adjustments 2026: How Surveyors Must Recalibrate for Lower-Priced Property Demand Surge is one thing; implementing these changes in daily practice is another. Surveyors must adopt new data sources, analytical techniques, and reporting frameworks to maintain professional standards.
Enhanced Data Collection Requirements
Traditional comparable sales analysis relied primarily on recent transactions within a defined geographic area. The 2026 market demands additional data layers:
Essential data sources for affordability-adjusted valuations:
- Builder incentive databases: Track actual incentives offered in target markets
- Regional income statistics: Monitor median household income trends by postcode
- Days on market trends: Identify affordability-driven market slowdowns
- Price reduction frequency: Understand seller pricing adjustments
- First-time buyer activity: Measure entry-level segment strength
- Feature-specific premiums: Quantify value of energy efficiency, flex spaces, EV charging
Surveyors should establish relationships with local estate agents, builders, and mortgage brokers to access real-time market intelligence beyond public records. This qualitative data complements quantitative analysis and provides context for valuation adjustments.
The Affordability-Adjusted Comparable Sales Method
The traditional comparable sales approach requires modification to incorporate affordability factors. Here's a step-by-step framework:
Step 1: Identify Comparable Properties
- Select 3-5 recent sales (within 6 months preferred, 12 months maximum)
- Match property type, size, condition, and location
- Prioritize transactions in same affordability segment
Step 2: Adjust for Builder Incentives
- Research incentives offered on each comparable
- Reduce stated sale price by estimated incentive value
- Document incentive types and estimated costs
Step 3: Apply Regional Affordability Factors
- Identify subject property's regional market (improving/stable/declining affordability)
- Apply appropriate adjustment (+1-3% for improving markets like West Midlands, North West, Wales)
- Justify adjustment based on market data and forecasts
Step 4: Feature-Specific Adjustments
- Compare practical features (flex spaces, EV charging, energy efficiency)
- Apply documented feature premiums
- Ensure adjustments reflect actual market behaviour
Step 5: Income-Based Validation
- Calculate maximum supportable price based on regional median income
- Apply standard lending multiples (typically 4-4.5x income)
- Flag valuations exceeding income-supported levels
Step 6: Market Time Analysis
- Review average days on market for comparable properties
- Adjust valuations downward for properties in slow-selling segments
- Consider seasonal factors and local market dynamics
This enhanced methodology ensures valuations reflect both traditional factors and affordability-driven market realities. For complex cases, choosing the right property survey type becomes crucial to gathering necessary data.
Technology and Tools for Affordability Analysis
Modern surveyors must leverage technology to efficiently incorporate affordability adjustments. Recommended tools include:
Valuation Software Enhancements:
- Automated incentive tracking modules
- Regional affordability index integration
- Feature premium databases
- Income-to-price ratio calculators
- Market time trend analysis
Data Analytics Platforms:
- Geographic information systems (GIS) for regional analysis
- Comparative market analysis (CMA) tools with affordability layers
- Builder incentive tracking databases
- Real-time market statistics dashboards
Professional Development:
- RICS guidance on affordability-adjusted valuations
- Regional market update webinars
- Builder strategy analysis workshops
- Economic forecasting training
Investing in these tools and training ensures surveyors can deliver Red Book valuations that meet professional standards while accurately reflecting 2026 market conditions.
Reporting and Documentation Standards
Transparency in affordability adjustments is essential for client confidence and professional defensibility. Valuation reports should include:
Required Documentation Elements:
📋 Market Context Section
- Regional affordability trends
- Builder confidence indicators
- Price-to-income ratio analysis
- Segment-specific market conditions
📋 Comparable Sales Analysis
- Detailed incentive adjustments with supporting documentation
- Regional affordability factor justification
- Feature premium calculations
- Income-based validation results
📋 Adjustment Reconciliation
- Summary table showing all adjustments
- Explanation of adjustment methodology
- Supporting market data and research
- Professional judgment rationale
📋 Risk Assessment
- Affordability sustainability analysis
- Market trend implications
- Valuation confidence level
- Potential value range (not just point estimate)
This enhanced reporting provides clients with clear understanding of how affordability factors influenced the final valuation. For specialized situations like divorce valuations or probate valuations, this documentation becomes particularly important for legal defensibility.
Case Study: Affordability-Adjusted Valuation in Practice
Subject Property: 3-bedroom semi-detached home, West Midlands, built 2024
Features: EV charging, flex space, enhanced insulation (EPC B)
Asking Price: £285,000
Traditional Comparable Sales Approach:
- Comparable 1: £280,000 (no incentives, standard features)
- Comparable 2: £290,000 (builder incentives unknown, similar features)
- Comparable 3: £275,000 (older property, no modern features)
- Traditional Valuation: £282,000
Affordability-Adjusted Approach:
| Comparable | Stated Price | Incentive Adjustment | Feature Adjustment | Regional Factor | Adjusted Price |
|---|---|---|---|---|---|
| Comp 1 | £280,000 | £0 | +£5,500 (EV + flex) | +£5,600 (+2%) | £291,100 |
| Comp 2 | £290,000 | -£10,000 | £0 | +£5,600 (+2%) | £285,600 |
| Comp 3 | £275,000 | £0 | +£8,500 (all features) | +£5,600 (+2%) | £289,100 |
Affordability-Adjusted Valuation: £288,600
Income Validation: Regional median income £35,000 × 4.5 = £157,500 × 1.8 (dual income) = £283,500 supportable
Final Valuation: £286,000 (balanced between comparables and income support)
This example demonstrates how affordability adjustments can significantly impact final valuations, potentially adding £4,000-£6,000 to traditional approaches in improving affordability markets.
Future-Proofing Valuation Practice for Evolving Affordability Dynamics
The property market continues evolving, and surveyors must anticipate future affordability trends to maintain relevance and accuracy. The Affordability-Led Valuation Adjustments 2026: How Surveyors Must Recalibrate for Lower-Priced Property Demand Surge represents current practice, but forward-thinking professionals are already preparing for next-generation challenges.
Monitoring Leading Indicators
Successful surveyors in 2026 and beyond will actively monitor leading indicators that signal affordability shifts:
Economic Indicators:
- Regional wage growth trends
- Employment rates by sector
- Interest rate forecasts
- Inflation projections
- Construction cost trends
Market Indicators:
- Builder confidence indices (NAHB/Wells Fargo HMI)
- Prospective buyer traffic levels
- Price reduction frequency and magnitude
- Incentive usage rates
- Days on market by price segment
Demographic Indicators:
- First-time buyer activity levels
- Household formation rates
- Migration patterns between regions
- Age-specific homeownership rates
- Dual-income household prevalence
By tracking these indicators, surveyors can anticipate affordability shifts before they fully manifest in transaction data, providing clients with forward-looking valuations rather than backward-looking assessments.
Scenario-Based Valuation Approaches
Given market uncertainty, progressive surveyors are adopting scenario-based valuation frameworks that provide clients with multiple value estimates under different affordability assumptions:
Base Case Scenario: Current affordability trends continue
- Regional growth of 1-3% in improving markets
- Stable builder incentive levels
- Gradual income growth matching inflation
Optimistic Scenario: Affordability improves faster than forecast
- Interest rate reductions increase buyer purchasing power
- Wage growth accelerates
- Builder confidence recovers
- Potential value increase: +3-5%
Pessimistic Scenario: Affordability deteriorates
- Economic slowdown reduces income growth
- Interest rates remain elevated
- Builder incentives increase further
- Potential value decrease: -2-4%
This approach acknowledges market uncertainty while providing clients with actionable intelligence for decision-making. It's particularly valuable for commercial property surveyors dealing with investment properties where cash flow projections depend on accurate value forecasts.
Continuous Professional Development
The rapid evolution of affordability-driven market dynamics demands ongoing professional development. Surveyors should prioritize:
Technical Skills:
- Advanced statistical analysis for affordability modelling
- Economic forecasting fundamentals
- Data visualization for client communication
- Technology integration for efficiency
Market Knowledge:
- Regional economic development plans
- Builder strategy and product evolution
- Government housing policy changes
- Demographic trend analysis
Professional Standards:
- RICS valuation standard updates
- Legal and regulatory changes
- Ethics in affordability-challenged markets
- Client communication best practices
Organizations offering local chartered surveyors services should invest in team training to ensure consistent application of affordability-adjusted methodologies across all valuations.
Building Client Relationships Through Market Expertise
Surveyors who master affordability-led valuation adjustments position themselves as trusted market experts rather than mere transaction facilitators. This expertise creates client value through:
Strategic Advisory Services:
- Optimal timing for property purchases or sales
- Investment property selection in affordability-improving regions
- Portfolio rebalancing recommendations
- Development feasibility assessments
Risk Management:
- Identifying overvalued properties in affordability-challenged segments
- Highlighting undervalued opportunities in improving markets
- Scenario planning for different market conditions
- Exit strategy development
Market Intelligence:
- Regular market updates and forecasts
- Regional affordability trend reports
- Builder strategy analysis
- Comparative regional performance data
By expanding beyond traditional valuation services, surveyors create recurring client relationships and establish themselves as indispensable market advisors. This positions practices for long-term success regardless of short-term market fluctuations.
Conclusion

The Affordability-Led Valuation Adjustments 2026: How Surveyors Must Recalibrate for Lower-Priced Property Demand Surge represents a fundamental shift in professional practice that cannot be ignored. With home prices having climbed 53% since 2019 while median household incomes increased only 24%, the traditional relationship between property values and buyer capacity has broken down[3]. Builder confidence falling to 36 in February 2026, with 67% offering sales incentives and 36% cutting prices, signals that the market has already adjusted—surveyors must follow suit[1][3].
The path forward requires surveyors to:
✅ Adopt segment-specific valuation frameworks that recognize different dynamics in entry-level, mid-range, and upper-tier properties
✅ Systematically adjust for builder incentives rather than accepting stated sale prices at face value
✅ Apply regional affordability factors reflecting forecast 1-3% growth in improving markets like West Midlands, North West, and Wales[2]
✅ Quantify practical feature premiums for EV charging, flex spaces, and energy efficiency that buyers increasingly demand
✅ Validate valuations against income-based affordability to ensure sustainable pricing
✅ Enhance reporting transparency to document affordability adjustments and build client confidence
✅ Monitor leading indicators to anticipate future market shifts before they appear in transaction data
The surveyors who embrace these changes will deliver more accurate valuations, better serve their clients, and establish themselves as trusted market experts. Those who cling to traditional methodologies risk producing valuations that fail to reflect market reality, potentially exposing clients to financial risk and damaging professional reputations.
Immediate Action Steps:
- Audit current valuation processes to identify where affordability adjustments should be incorporated
- Establish data collection systems for builder incentives, regional income trends, and feature premiums
- Invest in technology and training to efficiently implement affordability-adjusted methodologies
- Update report templates to include affordability analysis sections and adjustment documentation
- Develop client communication materials explaining the importance of affordability-led adjustments
- Network with builders, agents, and lenders to access real-time market intelligence
- Monitor regional forecasts and adjust valuation approaches as affordability dynamics evolve
The property market of 2026 demands a new generation of valuation professionals who understand that accurate property assessment requires more than comparable sales analysis—it requires deep market insight, economic understanding, and the professional courage to challenge traditional assumptions when market conditions warrant. The affordability crisis has reshaped the property landscape; surveyors must recalibrate accordingly.
For expert guidance on implementing affordability-led valuation adjustments in your specific market, consider consulting with experienced valuation professionals who understand both traditional methodologies and emerging market dynamics.
References
[1] Builder Sentiment Edges Lower On Affordability Concerns – https://www.nahb.org/news-and-economics/press-releases/2026/02/builder-sentiment-edges-lower-on-affordability-concerns
[2] Forecasting The Future What To Expect From House Prices In 2026 – https://surveyingcorp.com/2026/01/forecasting-the-future-what-to-expect-from-house-prices-in-2026/
[3] Housing Trends In 2026 What Builders Are Seeing – https://chicagoagentmagazine.com/2026/02/23/housing-trends-in-2026-what-builders-are-seeing/
[4] 2026 Valuation Advisory North American Market Survey – https://www.nmrk.com/insights/market-report/2026-valuation-advisory-north-american-market-survey
[5] dallasfed – https://www.dallasfed.org/research/economics/2026/0115
[6] Higher Rates Changed The Housing Market And These May Be The Rules Going Forward New Realtorcom Report 302693895 – https://www.prnewswire.com/news-releases/higher-rates-changed-the-housing-market-and-these-may-be-the-rules-going-forward-new-realtorcom-report-302693895.html